U.S. spot bitcoin ETFs have accumulated a net 4,500 BTC so far in 2026, with May marking a clear shift away from the steady buying seen earlier in the year, according to Swissblock data.
The slowdown suggests that the institutional demand underpinning bitcoin’s recent strength is beginning to fade.
After consistent inflows through March and April helped lift bitcoin from levels near $65,000, May has reversed course, with ETF flows turning into net distribution with only a few days left in the month.
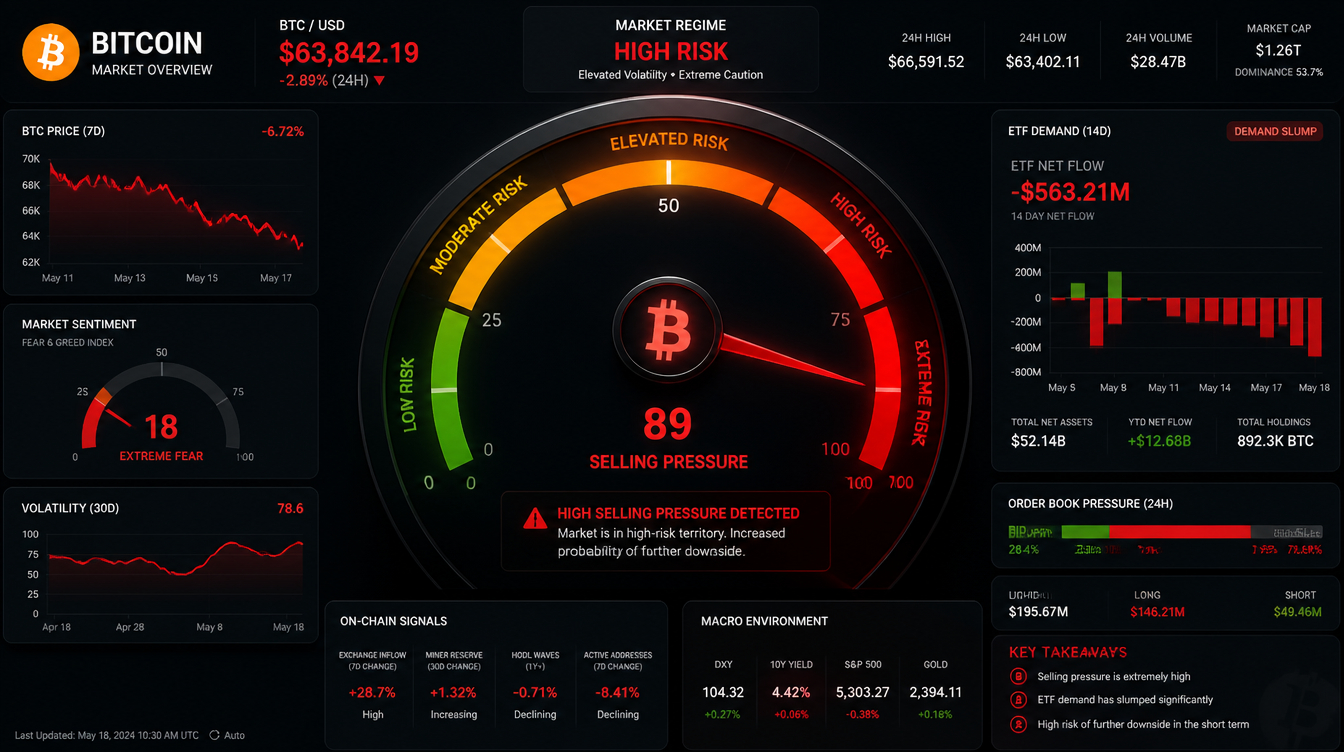
“Following strong accumulation in March and April, May has shifted back into distribution,” Swissblock said. “At the same time, the Risk Index is entering high-risk territory as ETF flows weaken, indicating that spot demand is no longer effectively absorbing selling pressure.”
This shift is significant because previous bitcoin rallies have relied heavily on ETF inflows to offset supply from miners, long-term holders, and profit-taking traders.
With that demand easing, the market may need to find new buyers or adjust to lower price levels to restore balance. Swissblock noted that its Risk Index—designed to track structural selling pressure versus demand—could continue to rise as long as ETF flows remain negative.
Bitcoin traded around $75,800 during Asian hours on Tuesday, down roughly 2.6% over the past month and near the lower end of its May range. The asset briefly pushed above $82,000 earlier in the month before macroeconomic pressures, including inflation-related data, dragged it back below $80,000.
Other major cryptocurrencies also declined, with ether, XRP, and solana in negative territory. Zcash led losses, dropping about 9% on the day.
Additional on-chain indicators are reinforcing the cautious outlook. Apparent demand—a measure of how much bitcoin the market is absorbing relative to new supply—has fallen to its weakest level since December.
At the same time, CryptoOnchain reported roughly $1.74 billion in outflows from U.S. spot ETFs over the past two weeks, while retail traders have been increasing leverage in anticipation of a rebound. Historically, such positioning has often preceded sharp liquidation events when markets move against crowded trades.
Despite the weakening signals, it remains unclear whether the current trend represents a temporary pause or the start of a deeper shift.
ETF inflows have slowed at other points in this cycle without triggering prolonged declines. Meanwhile, global equity markets continue to hover near record highs. Analysts also point to a potential “golden cross” forming in bitcoin, as its 50-day moving average approaches a crossover above the 200-day average—typically seen as a bullish technical signal.
Still, ETF demand has been a key driver of new capital entering the market. If that channel continues to weaken, the structural support behind bitcoin’s rally since April could come under increasing pressure.