A familiar cartoon-inspired chart pattern has returned to crypto market discussions as bitcoin, XRP and ether retreat following their recent rallies.
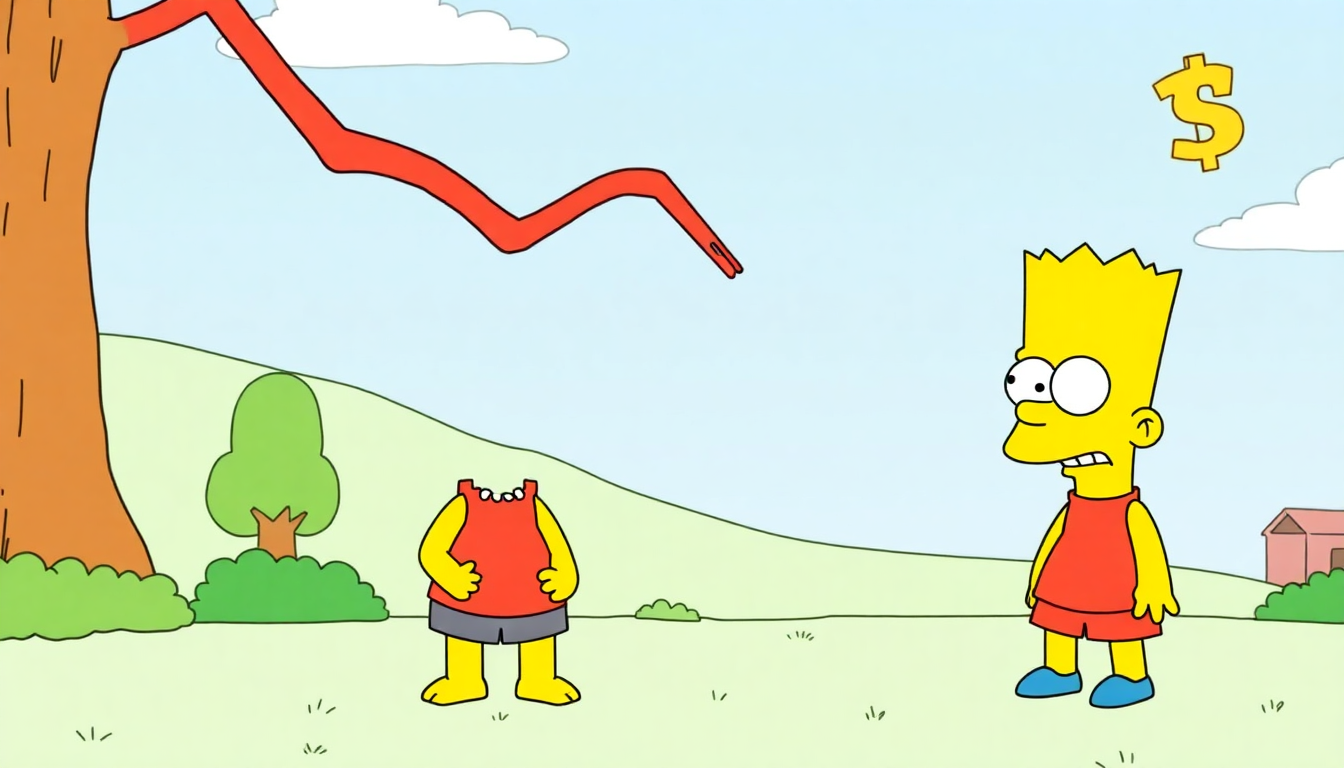
Traders are once again referring to the “Bart Simpson” pattern, named after the spiky-haired character from The Simpsons. The term describes a market move that shoots sharply higher, pauses in a relatively narrow range and then reverses lower, producing a chart shape similar to Bart’s hair.
Bitcoin (BTC), XRP and ether (ETH) are among the major cryptocurrencies giving back some of their recent gains. The bitcoin version of the pattern was first coined in 2015 by former X user @whaleclubco, when BTC traded at $229. The setup had not been a major topic of discussion for at least three years until traders flagged it again on Sept. 1.
The latest observations quickly reignited debate on crypto X. Ben Cowen, founder of Into the Cryptoverse and a market analyst, told his 1.2 million followers that bitcoin appeared to be forming the pattern.
The formation generally consists of three stages. The first is the Spike, a rapid price surge or decline that can encourage traders to chase a sudden move. The market then enters the Flat Range, or “head,” where prices consolidate within a tight band and trading volume tends to fade. Finally comes the Snap Back, a sharp reversal against the direction of the original Spike. When these three stages appear in sequence, the chart can take on the appearance of Bart Simpson.
Bitcoin’s potential pattern began with the Spike on Aug. 19, when BTC was trading near $64,420. By Aug. 21, bitcoin had climbed almost $14,000 to roughly $78,300. The rally eventually stalled below $80,700 on Aug. 25. CoinDesk data showed BTC trading around $76,500 at the time of writing.
The resulting price structure now looks similar to the cartoon character, with the market potentially moving through the Snap Back portion of the pattern.
Traders on X are split on whether the formation will fully play out. Some expect bitcoin to regain momentum and continue higher, while others believe a correction could provide another opportunity to buy before the next bullish leg.
Mati Greenspan, founder of Quantum Economics and former senior analyst at eToro, said bitcoin would have to decline by at least 20% before the move could be considered a genuine Bart Simpson pattern. Despite that threshold, he does not expect such a decline.
According to Greenspan, the setup was more common during bitcoin’s earlier years, when markets were thinner and less developed.
He said clean examples have become difficult to recall in recent years. The pattern can still emerge, he said, but stronger liquidity, greater market depth and increased institutional participation appear to have reduced its presence in bitcoin’s typical price action.
The pattern is not limited to bitcoin, Greenspan added, but he sees a notable case developing in XRP.
XRP’s almost vertical advance from about $1 to $1.70 provides the structure for a potential Bart Simpson formation. Greenspan said that a sharp reversal toward the starting point of the rally would make the comparison particularly relevant.
XRP’s Spike began on Aug. 19, the same day as bitcoin’s. The token jumped from roughly $1 to $1.52 by Aug. 22 before moving into the Flat Range phase. Since then, the range has gradually drifted lower, with XRP around $1.32 at the time of writing.
Frank Hepworth, CEO and founder of New Market Trading, takes a more cautious view of the formation. He characterized the Bart Simpson shape as a classic distribution pattern, where larger holders use retail demand as an opportunity to sell.
Hepworth said the pattern’s “hair” formed after bitcoin repeatedly encountered resistance at its 50-week moving average near $81,000. He described that level as the “last line in the sand” for bearish traders.
With BTC unable to overcome that resistance, Hepworth sees the possibility of a retreat toward $70,000. If selling accelerates, he believes bitcoin could eventually fall toward $58,000, prompting his firm to reduce its exposure.
XRP could face even greater pressure, Hepworth said, because its relative performance against bitcoin has deteriorated.
The XRP/BTC pair has moved below its 20-week moving average, a development Hepworth expects could lead XRP to underperform bitcoin during a broader market downturn. If BTC falls to around $70,000, he projects XRP could decline to between $0.55 and $1.21.
Should bitcoin drop as far as $58,000, XRP could potentially fall to $0.46, according to Hepworth.