Bitcoin Faces Bearish Crossovers as $86K Resistance Holds Firm
Bitcoin’s (BTC) attempt at a recovery has hit a roadblock, with the $86,000 mark proving difficult to breach. As a result, several key technical indicators are starting to suggest that the market may be shifting toward a bearish phase.
Since Sunday, Bitcoin has struggled to maintain momentum above the critical $86K resistance level. This inability to break higher has raised concerns about the potential for bearish alignment in key moving averages, particularly the 50-, 100-, and 200-hour simple moving averages (SMAs). These three SMAs are now trending in a way that typically signals a bearish market—stacked in descending order, with the shorter-term averages positioned below the 200-hour SMA.
The 50- and 100-hour SMAs have peaked and are on track to cross below each other, creating a bearish crossover. While Bitcoin’s price remains above the 200-hour SMA, the breakdown in shorter-term averages suggests growing selling pressure in the market.
Additionally, the daily MACD histogram has stopped forming higher bars, signaling a loss of upward momentum and supporting the view that the market is losing bullish strength.
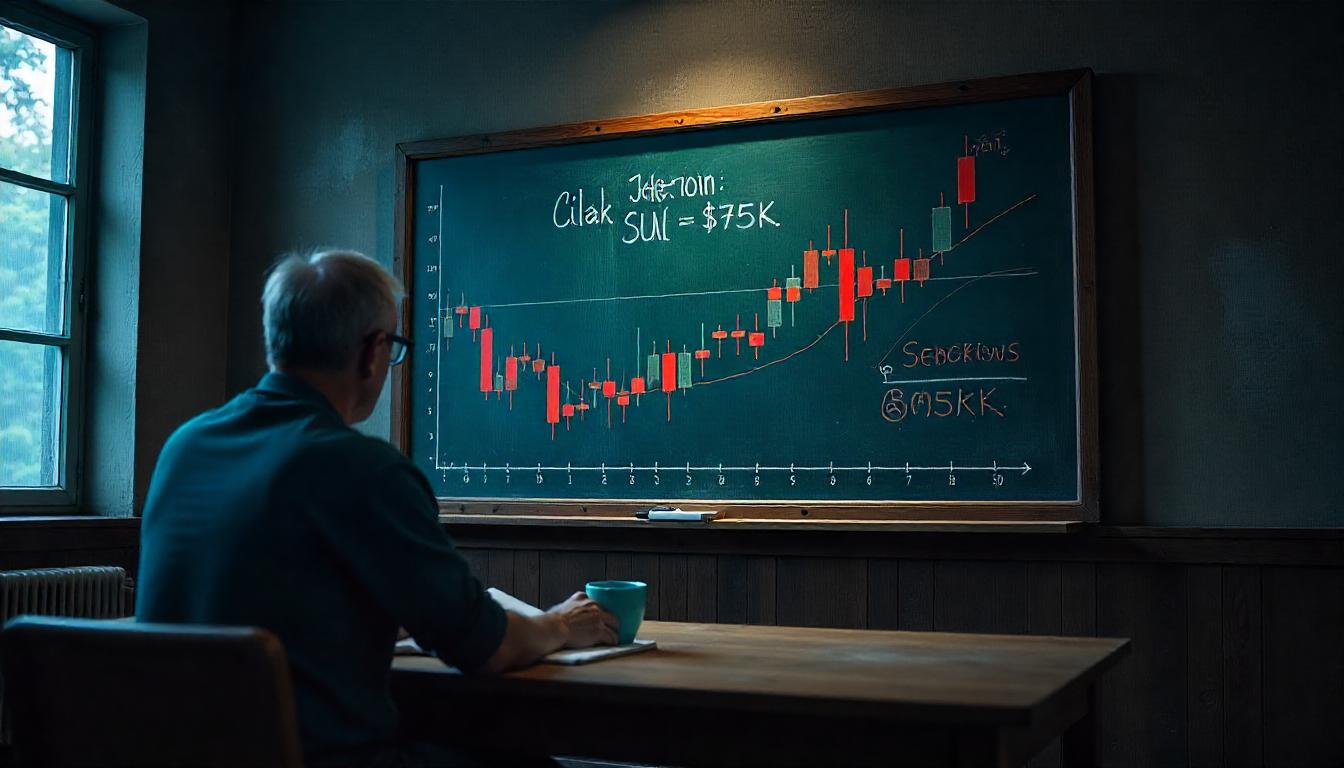
With the 50- and 100-day SMAs also showing downward trends, caution is warranted. A decline below the $83,000 support level could confirm the bearish trend, possibly leading to a pullback toward $75,000.
However, for the bulls to regain control, Bitcoin would need to close above $86,000 on the UTC chart to signal that the recovery rally is still viable.