Bitcoin has broken below a major technical support level, signaling a shift in market behavior and interrupting a bullish pattern that has held for more than a year.
BTC — recently trading around $90,091.77 — has now endured a breakdown reminiscent of the move seen earlier in Strategy (MSTR), falling through a price zone that traders had long treated as a dependable point for rebounds. Over the week ending Nov. 16, the cryptocurrency declined nearly 10%, closing with a large bearish weekly candle that pierced decisively below the 50-week simple moving average (SMA), according to TradingView.
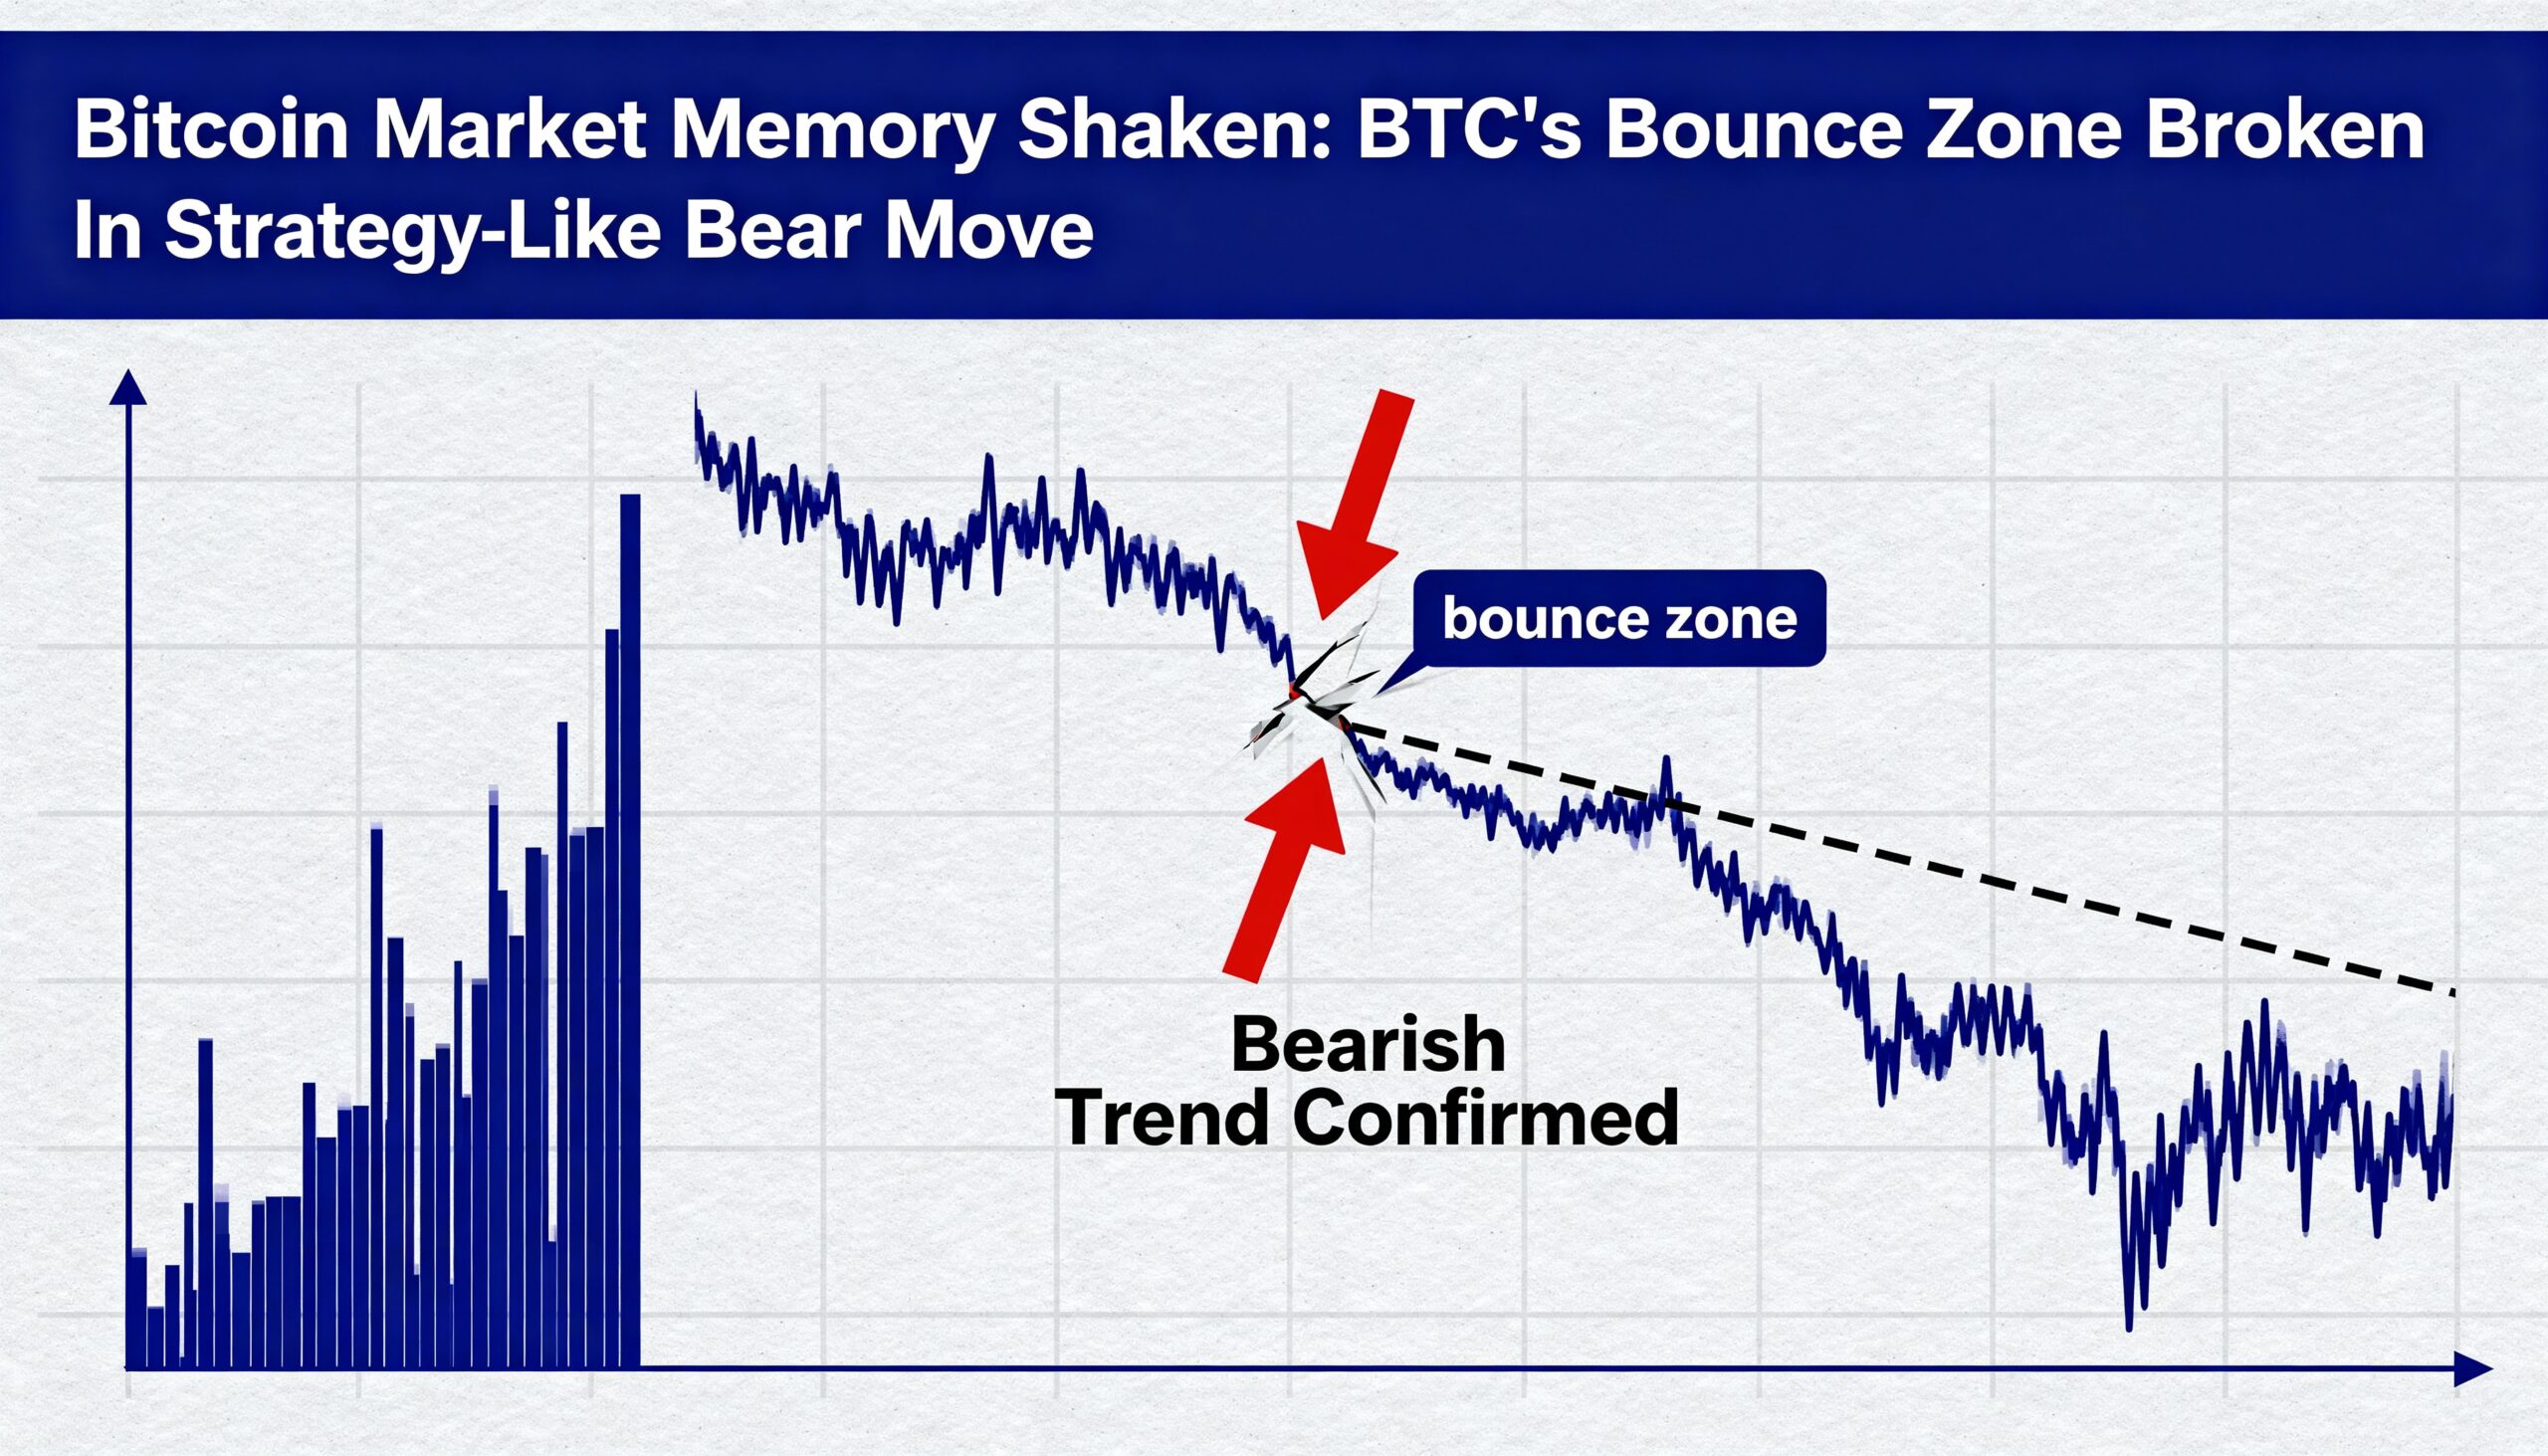
This drop marks a clear failure of a previously strong demand zone. With this structural support no longer intact, the broader trend has shifted from confident accumulation to heightened caution. Market participants who consistently bought dips may now rotate toward selling into strength, adjusting expectations for deeper downside.
From early 2023 onward, the 50-week SMA served as a resilient floor, repeatedly catching price pullbacks and helping spark multiple rallies to new all-time highs. That reliability now appears compromised.
The precedent set by Strategy (MSTR) offers a notable warning. When the stock broke its own long-held 50-week SMA, confidence faded quickly, and the asset slid into a continued sell-off. CoinDesk previously highlighted the implications of MSTR’s technical breakdown, suggesting Bitcoin could experience a similar reaction — a scenario that now appears to be unfolding.
With Bitcoin below the 50-week SMA, this level has effectively flipped from support to resistance. Any rebound toward the $102,868 area is likely to encounter selling pressure. Analysts say BTC would need sustained weekly closes back above that region to reassert a durable bullish trend.
Meanwhile, MSTR — the largest publicly traded holder of bitcoin — fell under its 50-week SMA in September and has since declined toward $200, marking its lowest level since October 2024.