Bitcoin’s Monthly MACD Flashes Bearish Signal
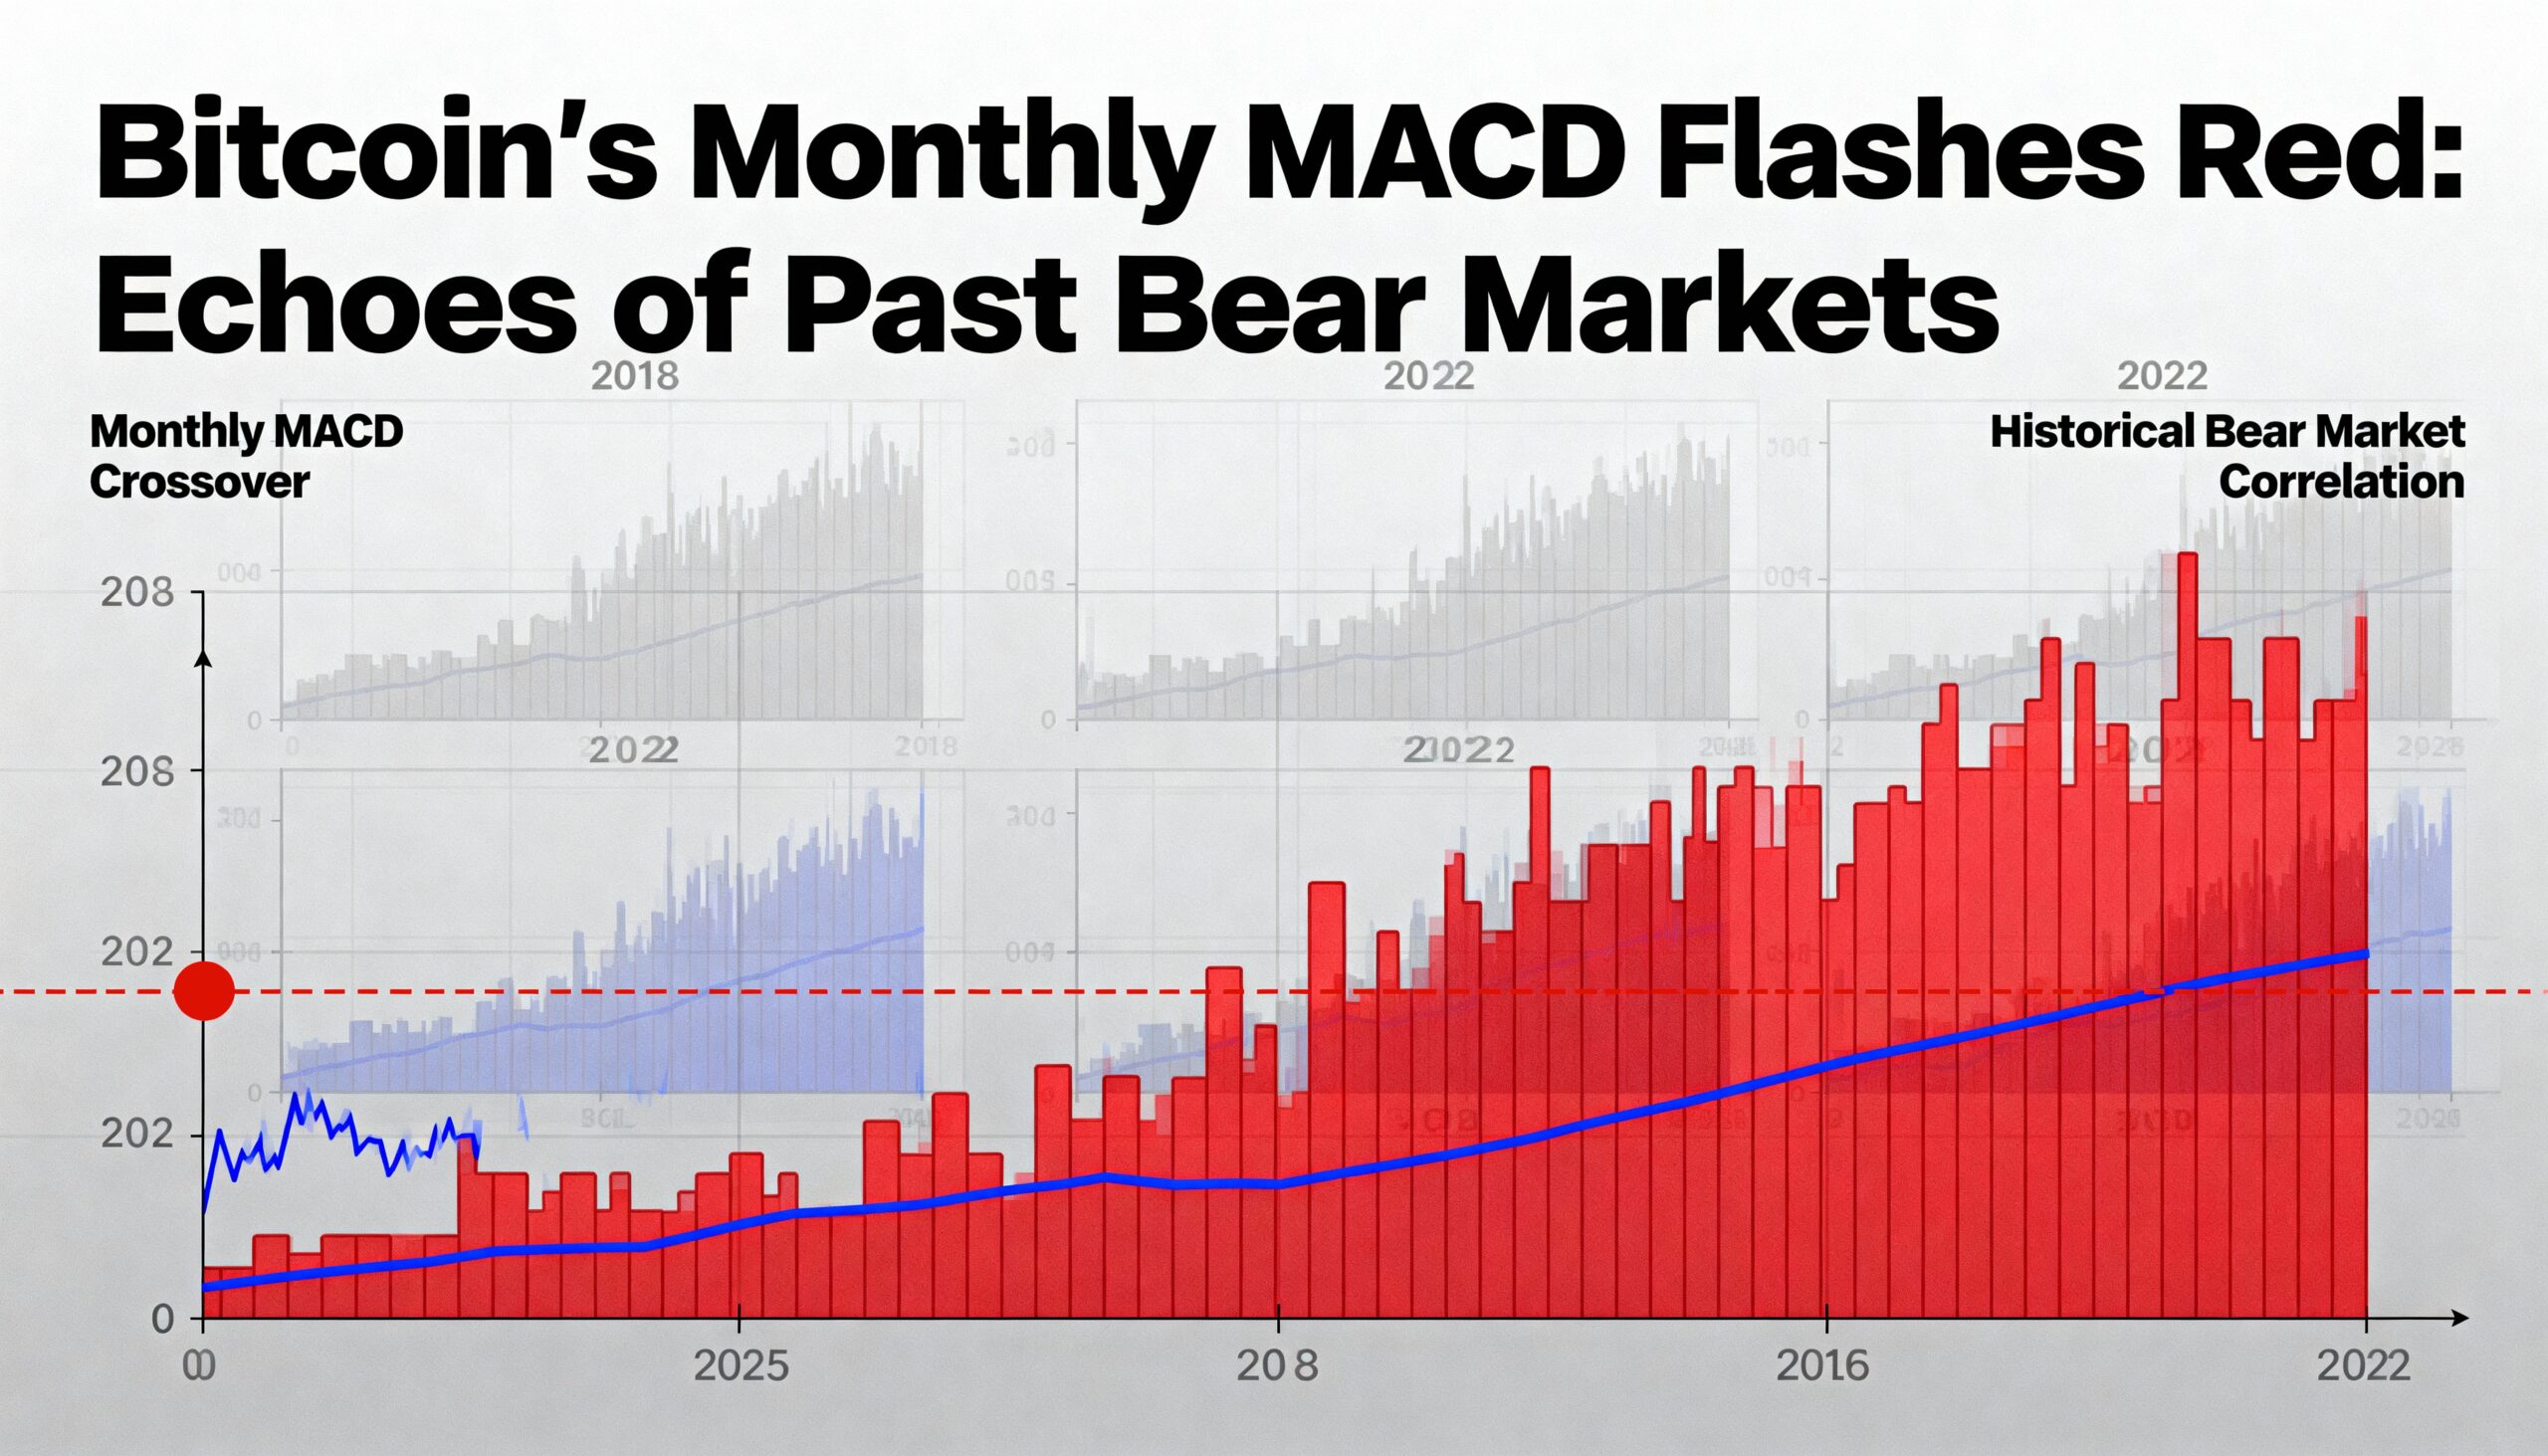
Bitcoin (BTC) has seen its monthly MACD histogram turn red, signaling a potential shift from bullish to bearish momentum. In November, the indicator printed its first red bar below zero as prices fell over 17%, suggesting the recent bull run from around $20,000 has ended and bears are in control.
Historically, bearish MACD crossovers have preceded deeper market corrections. After BTC fell from roughly $70,000 to $50,000 in late 2021, the MACD turned negative in January 2022, foreshadowing further declines below $20,000. Similar patterns appeared in 2018 and 2014.
Macro headwinds—including Japan’s fiscal strain, a strong dollar index, resilient Treasury yields, and spot ETF outflows—add to the bearish case. Key support lies at $84,500, with further downside to April’s $74,500 low and the 2021 peak near $70,000 if breached.
Ethereum (ETH) also shows caution, with a confirmed death cross signaling short-term weakness, though its predictive track record is mixed.