Bitcoin continued its decline in Asian hours, slipping beneath $63,000 as investors reacted to renewed tariff uncertainty tied to President Donald Trump and lingering volatility around AI-driven equity weakness.
The world’s largest cryptocurrency by market capitalization is now down roughly 7% for the week, trading near levels last seen on Feb. 6, when prices briefly approached $60,000, according to CoinDesk data.
Market participants pointed to macro pressures as the primary catalyst. Matt Howells-Barby, vice president at Kraken and host of Trading Spaces, said the latest pullback mirrors prior tariff-related turbulence seen earlier this year. He added that rising geopolitical tensions could add to short-term downside risks for BTC.
According to Howells-Barby, the $60,000 level remains a crucial support zone. A sustained break below that threshold could open the door to a move into the mid-to-low $50,000 range.
U.S. equities also weakened after Trump announced plans to raise temporary import tariffs to 15%, up from the 10% rate introduced days earlier, following a ruling by the Supreme Court of the United States that invalidated his prior tariff framework. At the same time, investors continued trimming exposure to companies perceived as vulnerable to disruption from artificial intelligence advancements.
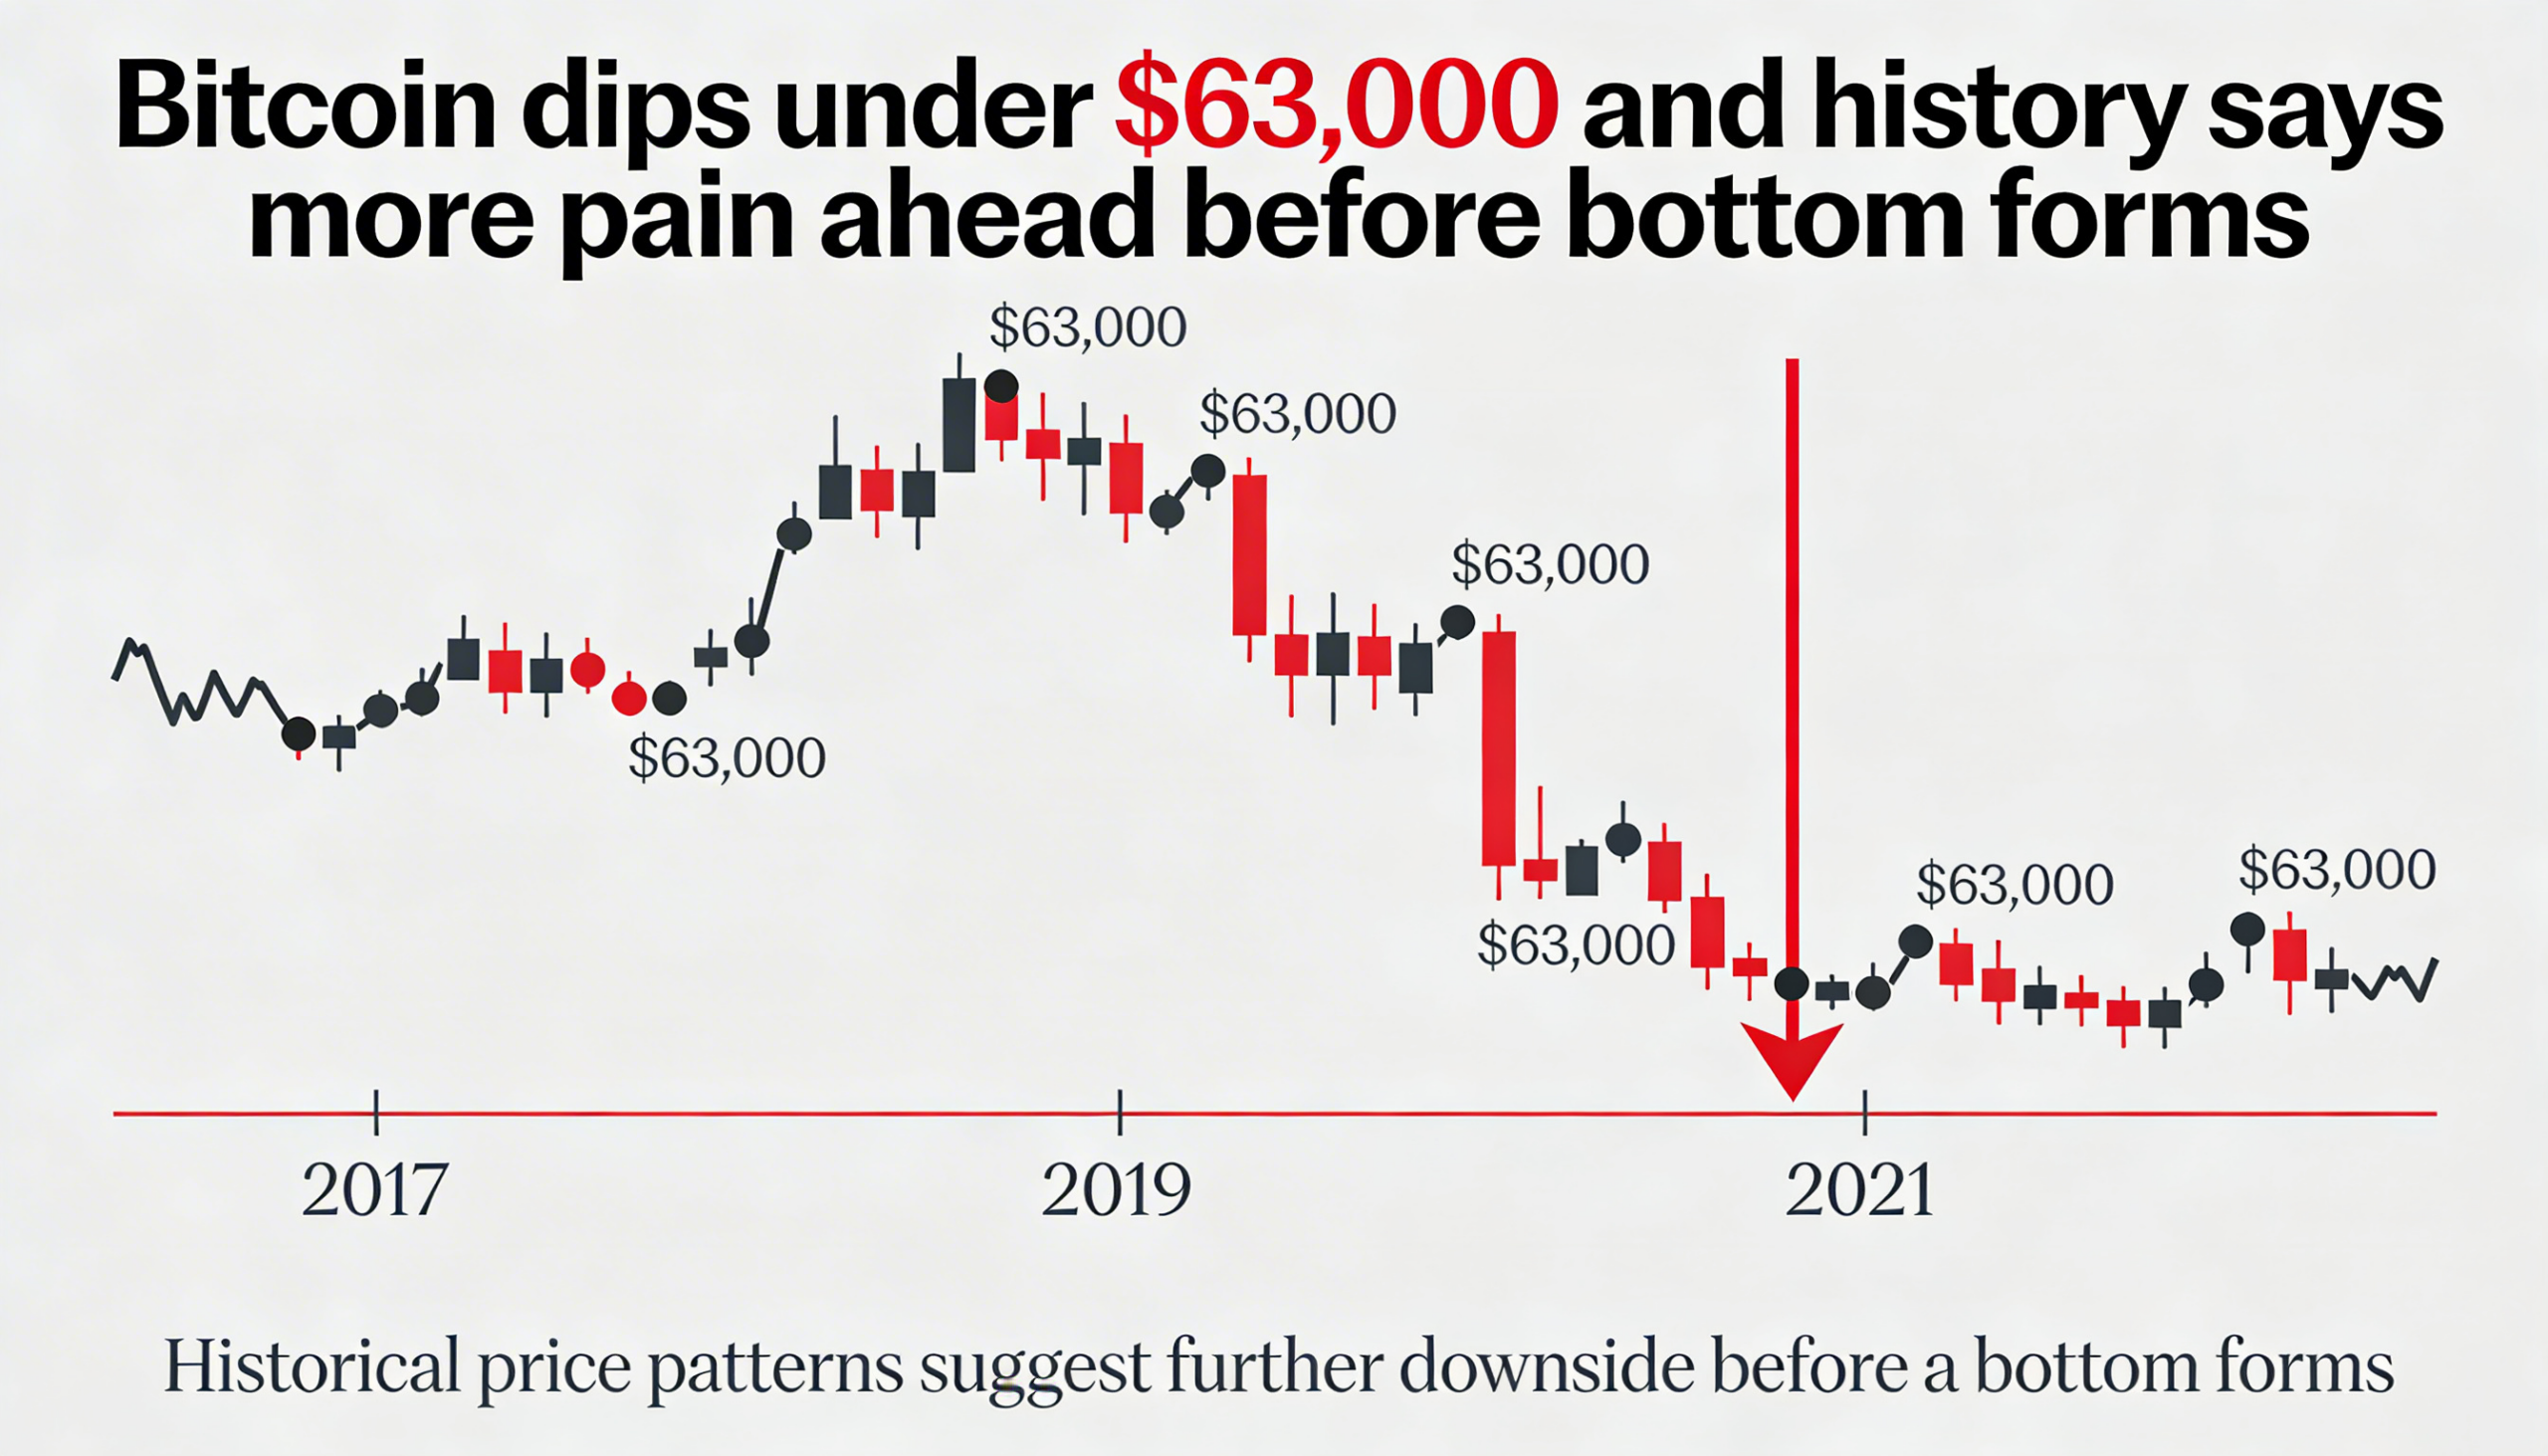
Technical Signals Suggest Further Downside Risk
From a longer-term perspective, historical price behavior indicates bitcoin may not yet be near a definitive cycle low. In past bear markets — including 2018 and 2022 — BTC formed durable bottoms only after its 50-week moving average crossed below its 100-week moving average, a technical pattern commonly referred to as a “bear cross.”
That crossover has not yet materialized in the current cycle, with the 50-week average still positioned above the 100-week.
If previous patterns repeat, bitcoin could experience additional weakness — potentially toward $50,000 or below — before longer-term capitulation occurs. Several analysts speaking at industry events in Hong Kong have similarly cautioned that the correction may not be complete.
While the bear cross may appear to signal worsening momentum, moving averages are inherently lagging indicators. Historically, the crossover has tended to confirm that the bulk of selling pressure has already unfolded, aligning with major cycle bottoms.
Nevertheless, technical indicators are not guarantees. Past market behavior does not ensure the same outcome in future cycles.