Rising volatility, historical seasonality and relative-value metrics are prompting fresh debate over whether silver is nearing a blow-off top.
Across asset classes, late-stage bull markets often invite attempts to pinpoint the peak. Investors frequently seek confirmation by referencing well-known contrarian calls — most famously Michael Burry’s warning ahead of the 2007 housing collapse. That instinct tends to intensify as price gains accelerate and swings grow sharper, conditions now clearly visible in the silver market.
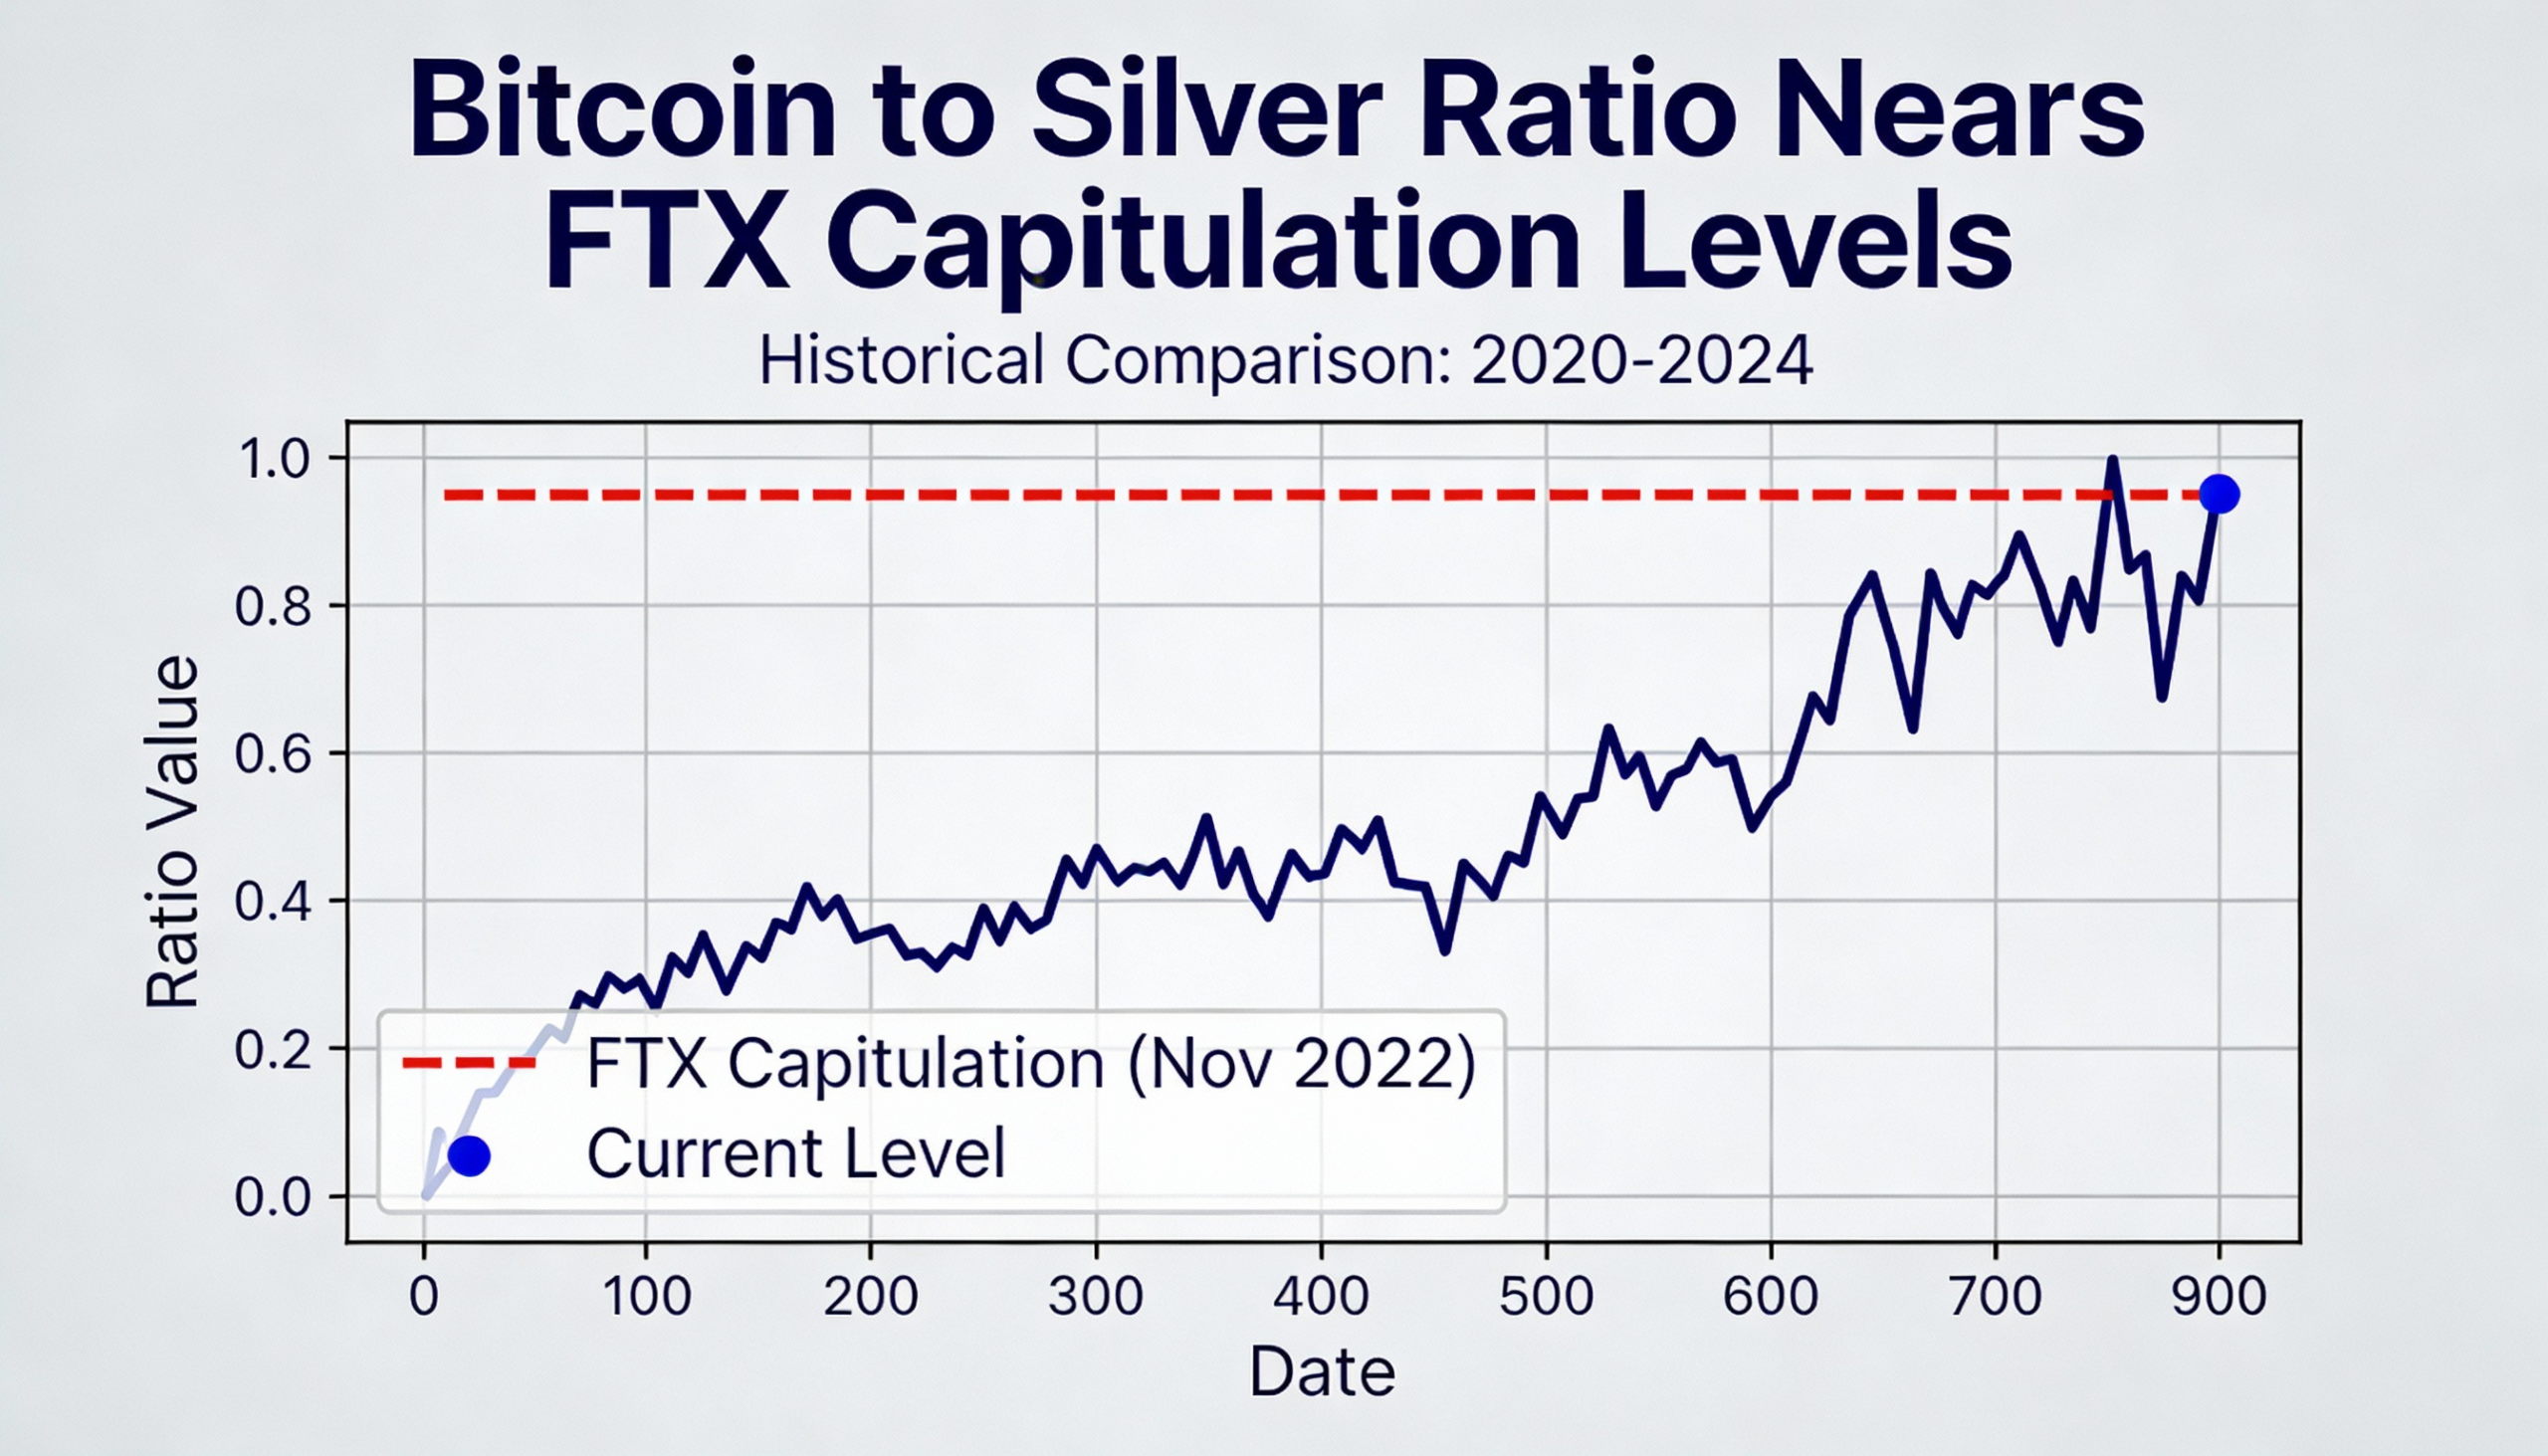
Bitcoin–Silver Ratio
The bitcoin-to-silver ratio is currently hovering around 780, slipping below its 2017 high when bitcoin peaked near $20,000 and approaching levels last seen in November 2022, when bitcoin bottomed near $15,500 and the ratio fell to roughly 700. The move suggests silver may be becoming increasingly vulnerable relative to bitcoin.
Silver prices have surged nearly 300% over the past year. On Monday, the metal experienced a sharp reversal, falling almost 15% after rising by a similar amount earlier in the session. Prices briefly spiked to around $117 per ounce before pulling back toward $112, highlighting the market’s heightened instability.
Long-term price history adds to the cautionary signals. Local peaks in silver have often formed early in the calendar year, with most occurring in the first half. Past examples include February 1974; January 1980, which marked a textbook blow-off top near $47; February 1983; May 1987; February 1998; April 2004; May 2006; March 2008; and April 2011, when silver peaked near $50 during another blow-off phase.
Taken together, the combination of stretched price gains, rising volatility and historical timing patterns raises a red flag. If previous cycles offer a reliable guide, silver’s recent behavior may point to a cyclical high — or the early stages of a blow-off top.