Bitcoin’s ‘Moonvember’ Myth Meets Reality
November 3, 2025
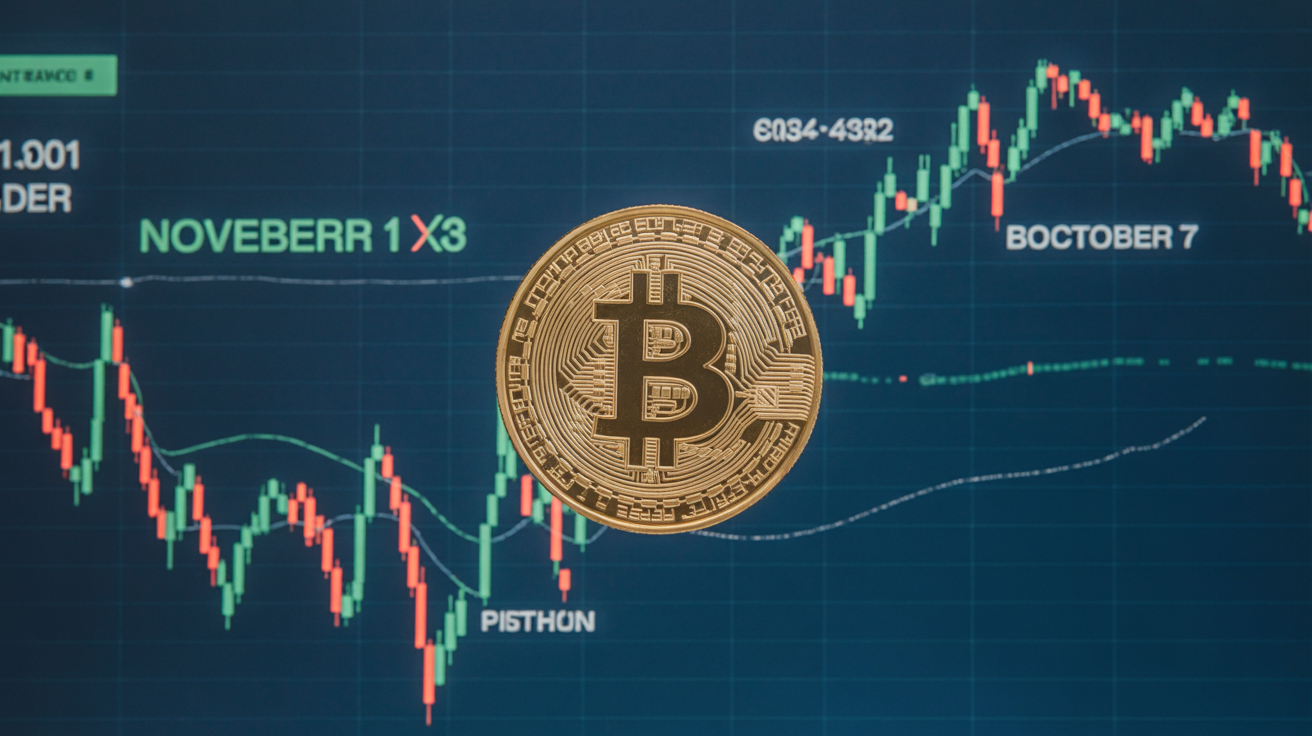
November has long been regarded as Bitcoin’s strongest month — a period traders affectionately call “Moonvember” for its history of outsized gains. But the data behind that narrative tells a more tempered story.
According to CoinGlass’s Bitcoin Monthly Returns heat map, Bitcoin’s average November gain from 2013 to 2025 stands at an impressive 42.5%, the highest of any month and well above October’s 19.9% average. Yet that figure is skewed by one massive outlier: November 2013, when Bitcoin soared 449% in a single month during its first major bull run.
When that exceptional year is excluded, Bitcoin’s median November return drops to just 8.8%, offering a more realistic view of the month’s typical performance. The difference between mean and median underscores how one extraordinary rally can distort perceptions of historical strength.
The month’s record is mixed. Bitcoin has posted steep losses in 2018 (-36.6%), 2019 (-17.3%), 2021 (-7.1%), and 2022 (-16.2%), alongside powerful gains in 2020 (+43%) and 2024 (+37.3%). Even this year’s modest 0.5% increase shows that November’s performance isn’t reliably bullish.
While historical patterns like “Moonvember” capture trader imagination, they aren’t price signals. As analysts note, seasonality reflects probability, not certainty. Real confirmation, they say, comes from the charts — through breakouts, volume surges, and improving market breadth — not from the calendar.