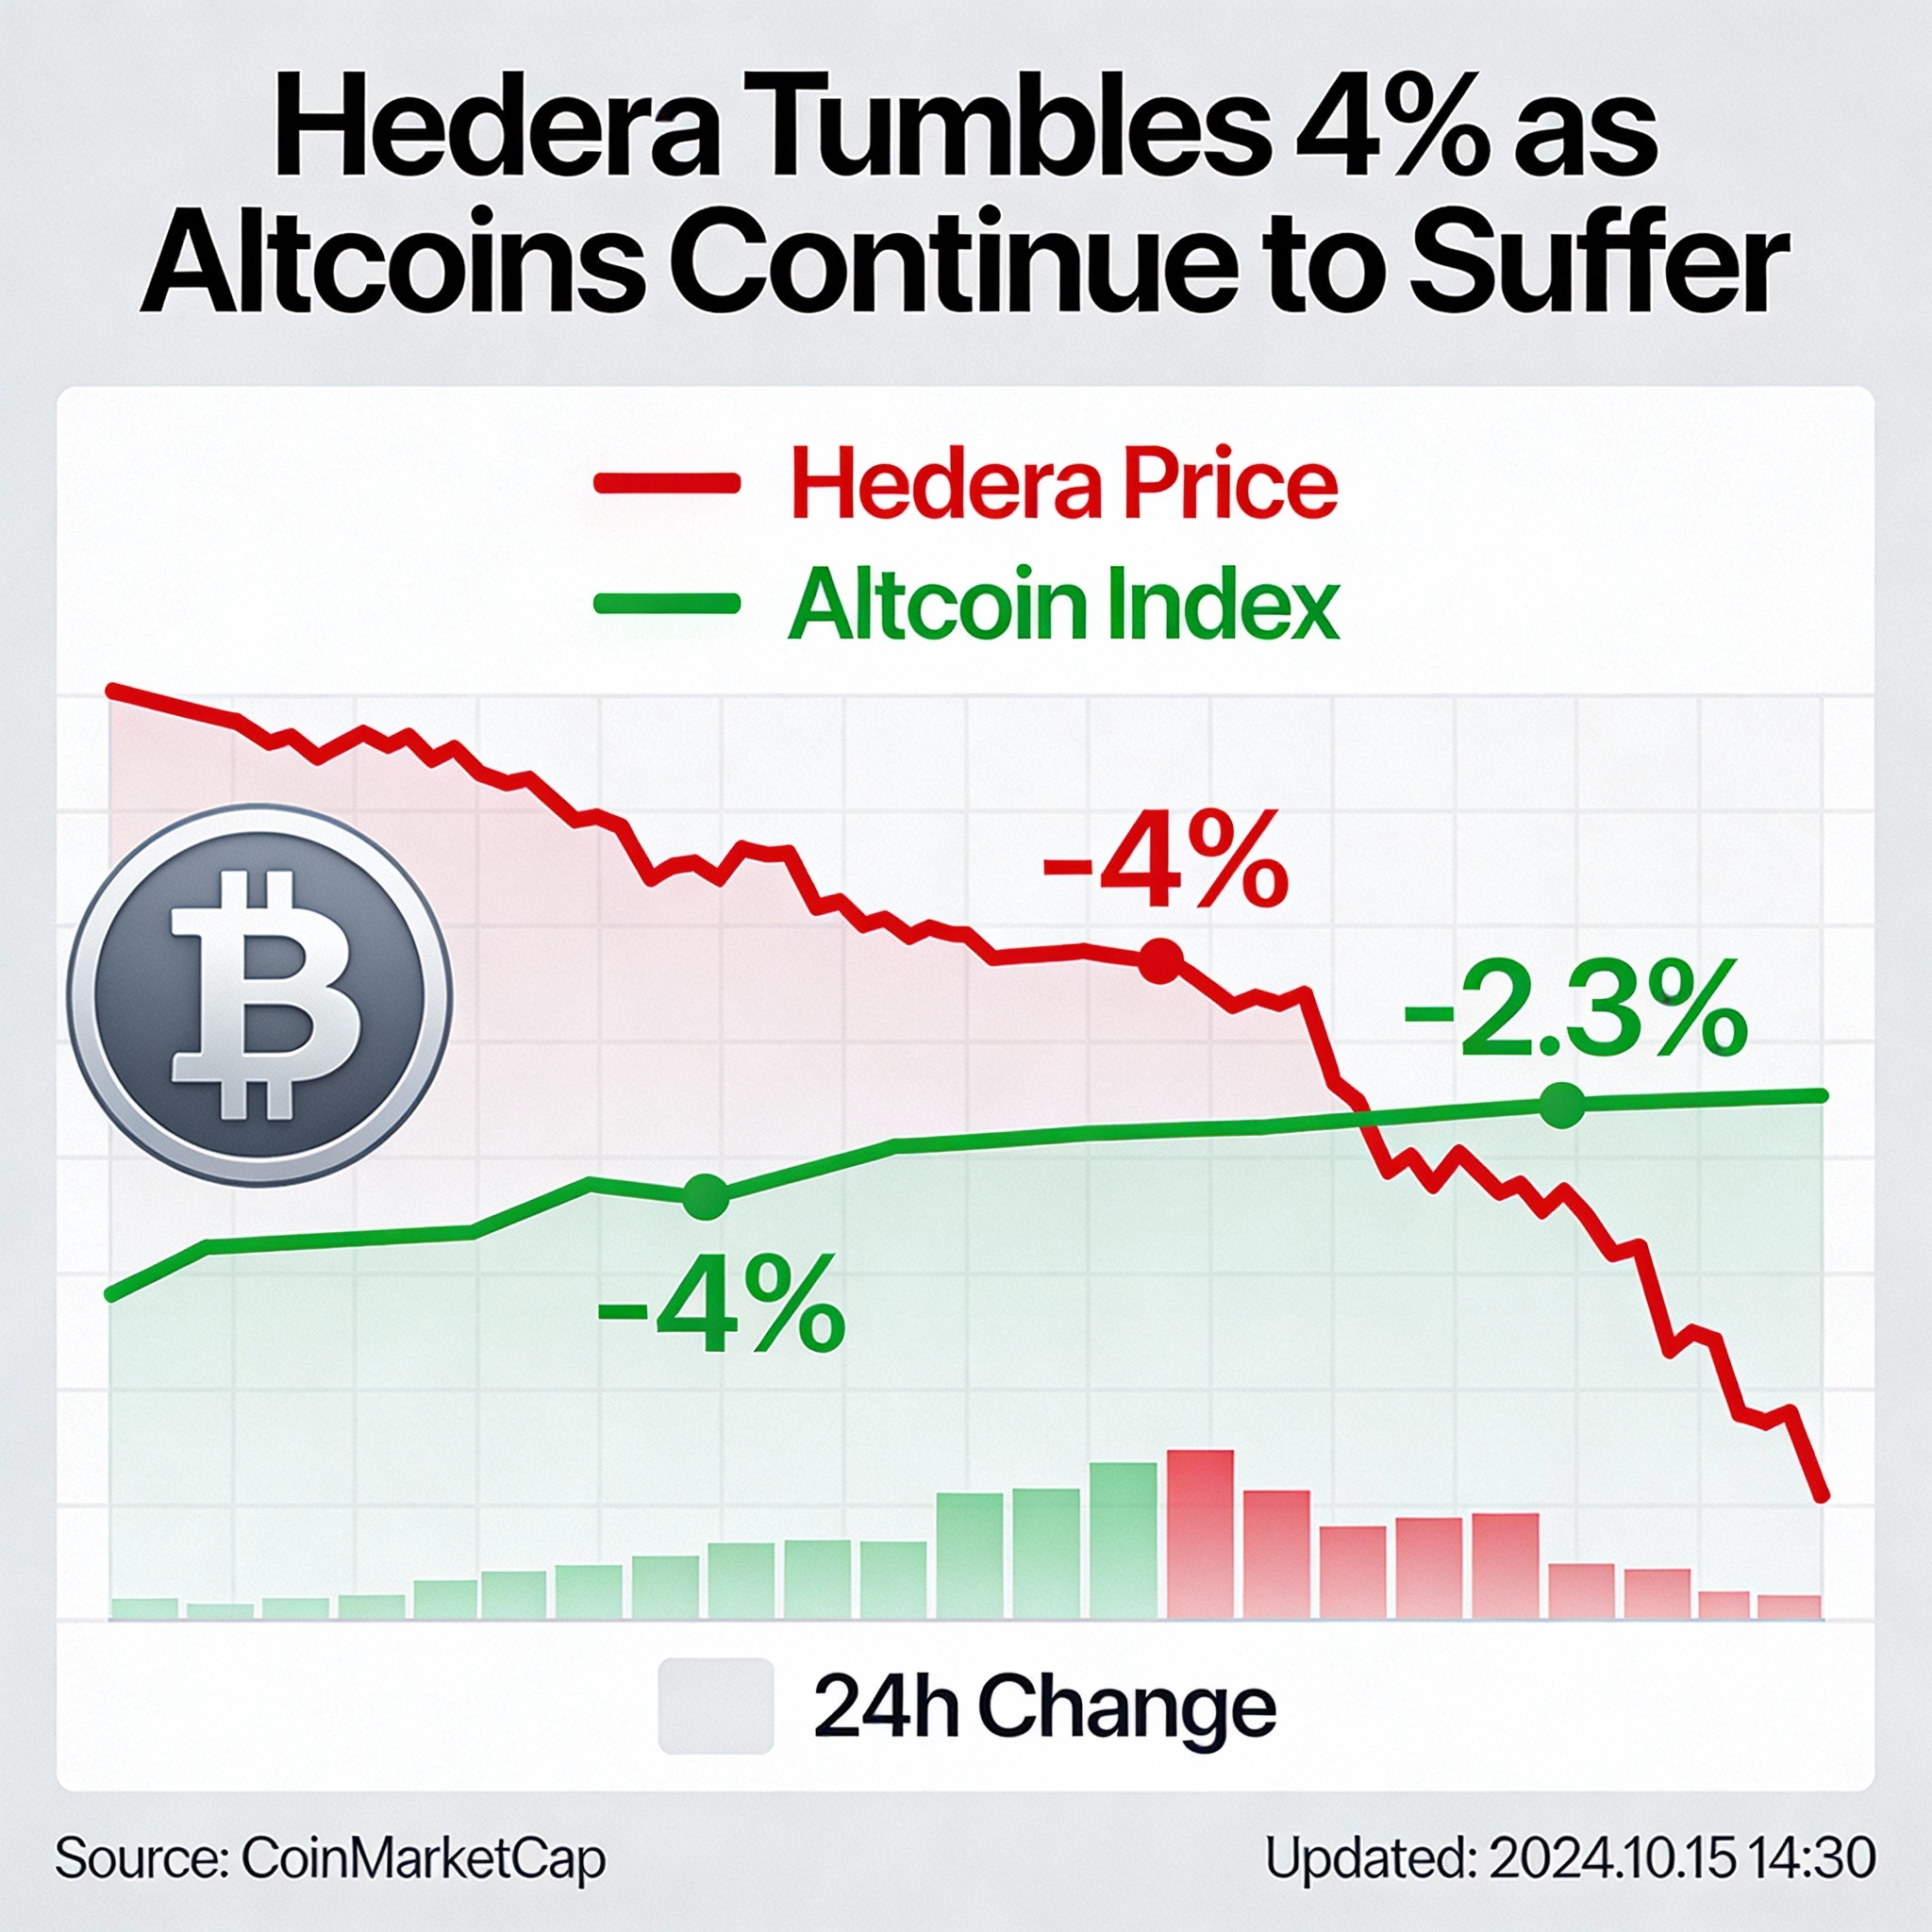
Hedera’s HBAR slid on Thursday after a failed attempt to extend gains beyond a key resistance zone, with heavy trading volume accompanying a sharp afternoon reversal.
The token dropped 4% to $0.1247 as selling pressure intensified, breaking through several technical levels and unwinding earlier advances. HBAR registered a $0.0082 intraday range—equivalent to 6.4% volatility—after buyers were unable to overcome resistance at $0.1320.
Volume expanded significantly during the session, signaling strong participation from institutional traders rather than thin liquidity typical of smaller altcoins. The elevated activity points to broad-based price discovery as positions were adjusted during the downturn.
The afternoon selloff confirmed a lower-high formation relative to the Dec. 11 peak, weakening the broader technical structure. As momentum shifted, HBAR slipped below previously defended support areas, accelerating the decline.
Price action has since stabilized near $0.1235, now a key level to watch. Following a brief capitulation, HBAR traded within a narrow $0.124–$0.125 band, opening the possibility of a short-term mean reversion move toward $0.126.
Despite the stabilization, sentiment remains cautious. The decisive loss of higher-timeframe support, combined with unusually strong sell-side volume, suggests conviction selling and limits near-term upside even as buyers attempt to regain control.
Technical Snapshot: HBAR Searches for Direction
Support and Resistance
- Immediate support holding near $0.1235 after the decline
- Strong resistance reaffirmed at $0.1320 following repeated rejections
- Short-term consolidation forming between $0.123 and $0.125 on 60-minute charts
Volume Trends
- Total volume surged to 165.9 million tokens, 175% above the 24-hour average
- Hourly flash-crash volume peaked at 15.7 million tokens, roughly 700% above normal
- Sustained elevated activity underscores institutional involvement
Chart Structure
- Lower-high pattern from the Dec. 11 peak confirms a bearish shift
- Flash-crash-and-recovery formation suggests accumulation near support
- Breakdown across multiple support levels signals deteriorating momentum
Targets and Risk
- Near-term upside target sits at $0.126 on a mean reversion attempt
- Downside risk extends to the $0.123 support floor if consolidation fails
- Overhead resistance remains at $0.1285, the site of the initial breakdown