History indicates bitcoin’s latest momentum washout may result in an extended consolidation phase near $60,000 before any meaningful push higher resumes.
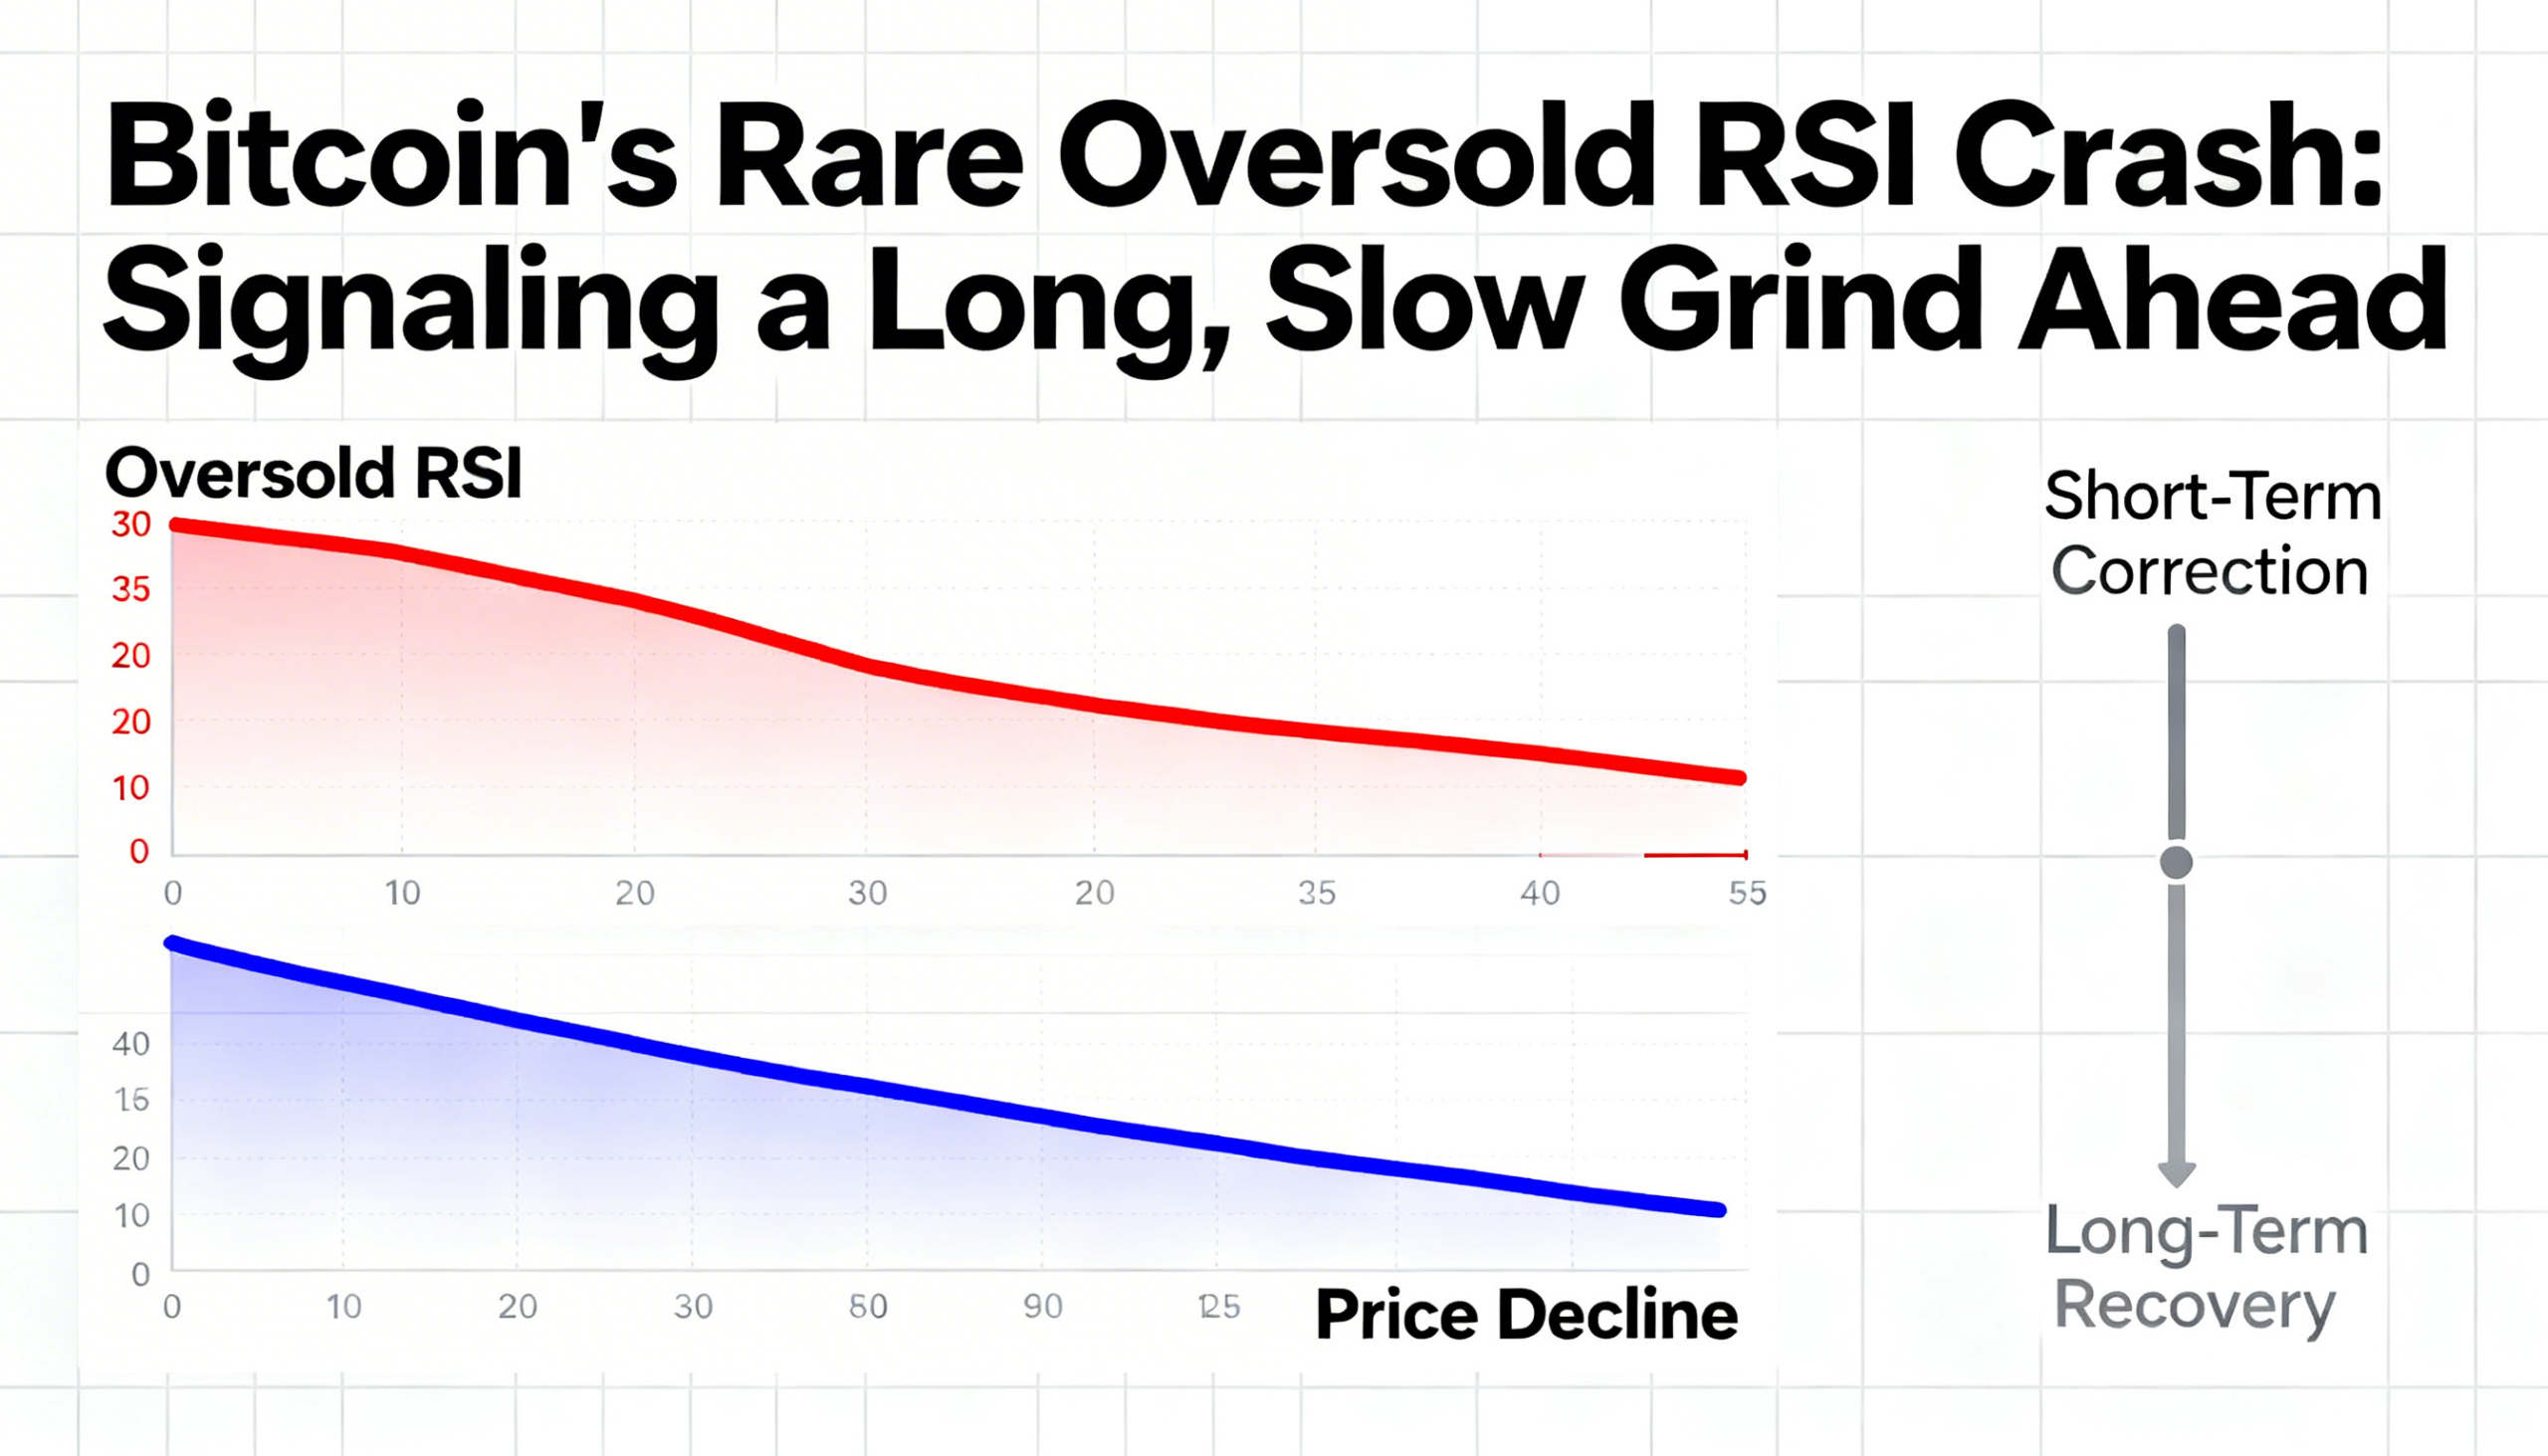
Bitcoin’s 14-day Relative Strength Index (RSI) slipped below 30 this month for just the third time on record, according to Checkonchain.
The RSI is a widely used momentum oscillator that measures the speed and magnitude of recent price changes, comparing average gains and losses over a 14-day period. The indicator ranges from 0 to 100, with readings above 70 typically viewed as overbought and levels below 30 considered oversold — a signal that selling pressure may be stretched. Bitcoin’s 14-day RSI has not approached extreme overbought territory since December 2024, when the asset first broke above $100,000.
Historically, dips below 30 have coincided with major cycle lows. In January 2015, bitcoin’s RSI fell to around 28 as prices hovered near $200. The market then entered roughly eight months of sideways consolidation before a sustained recovery took hold. A comparable setup unfolded in December 2018, when the RSI again dropped under 30 near the $3,500 level. That period was followed by about three months of accumulation before bitcoin staged a breakout.
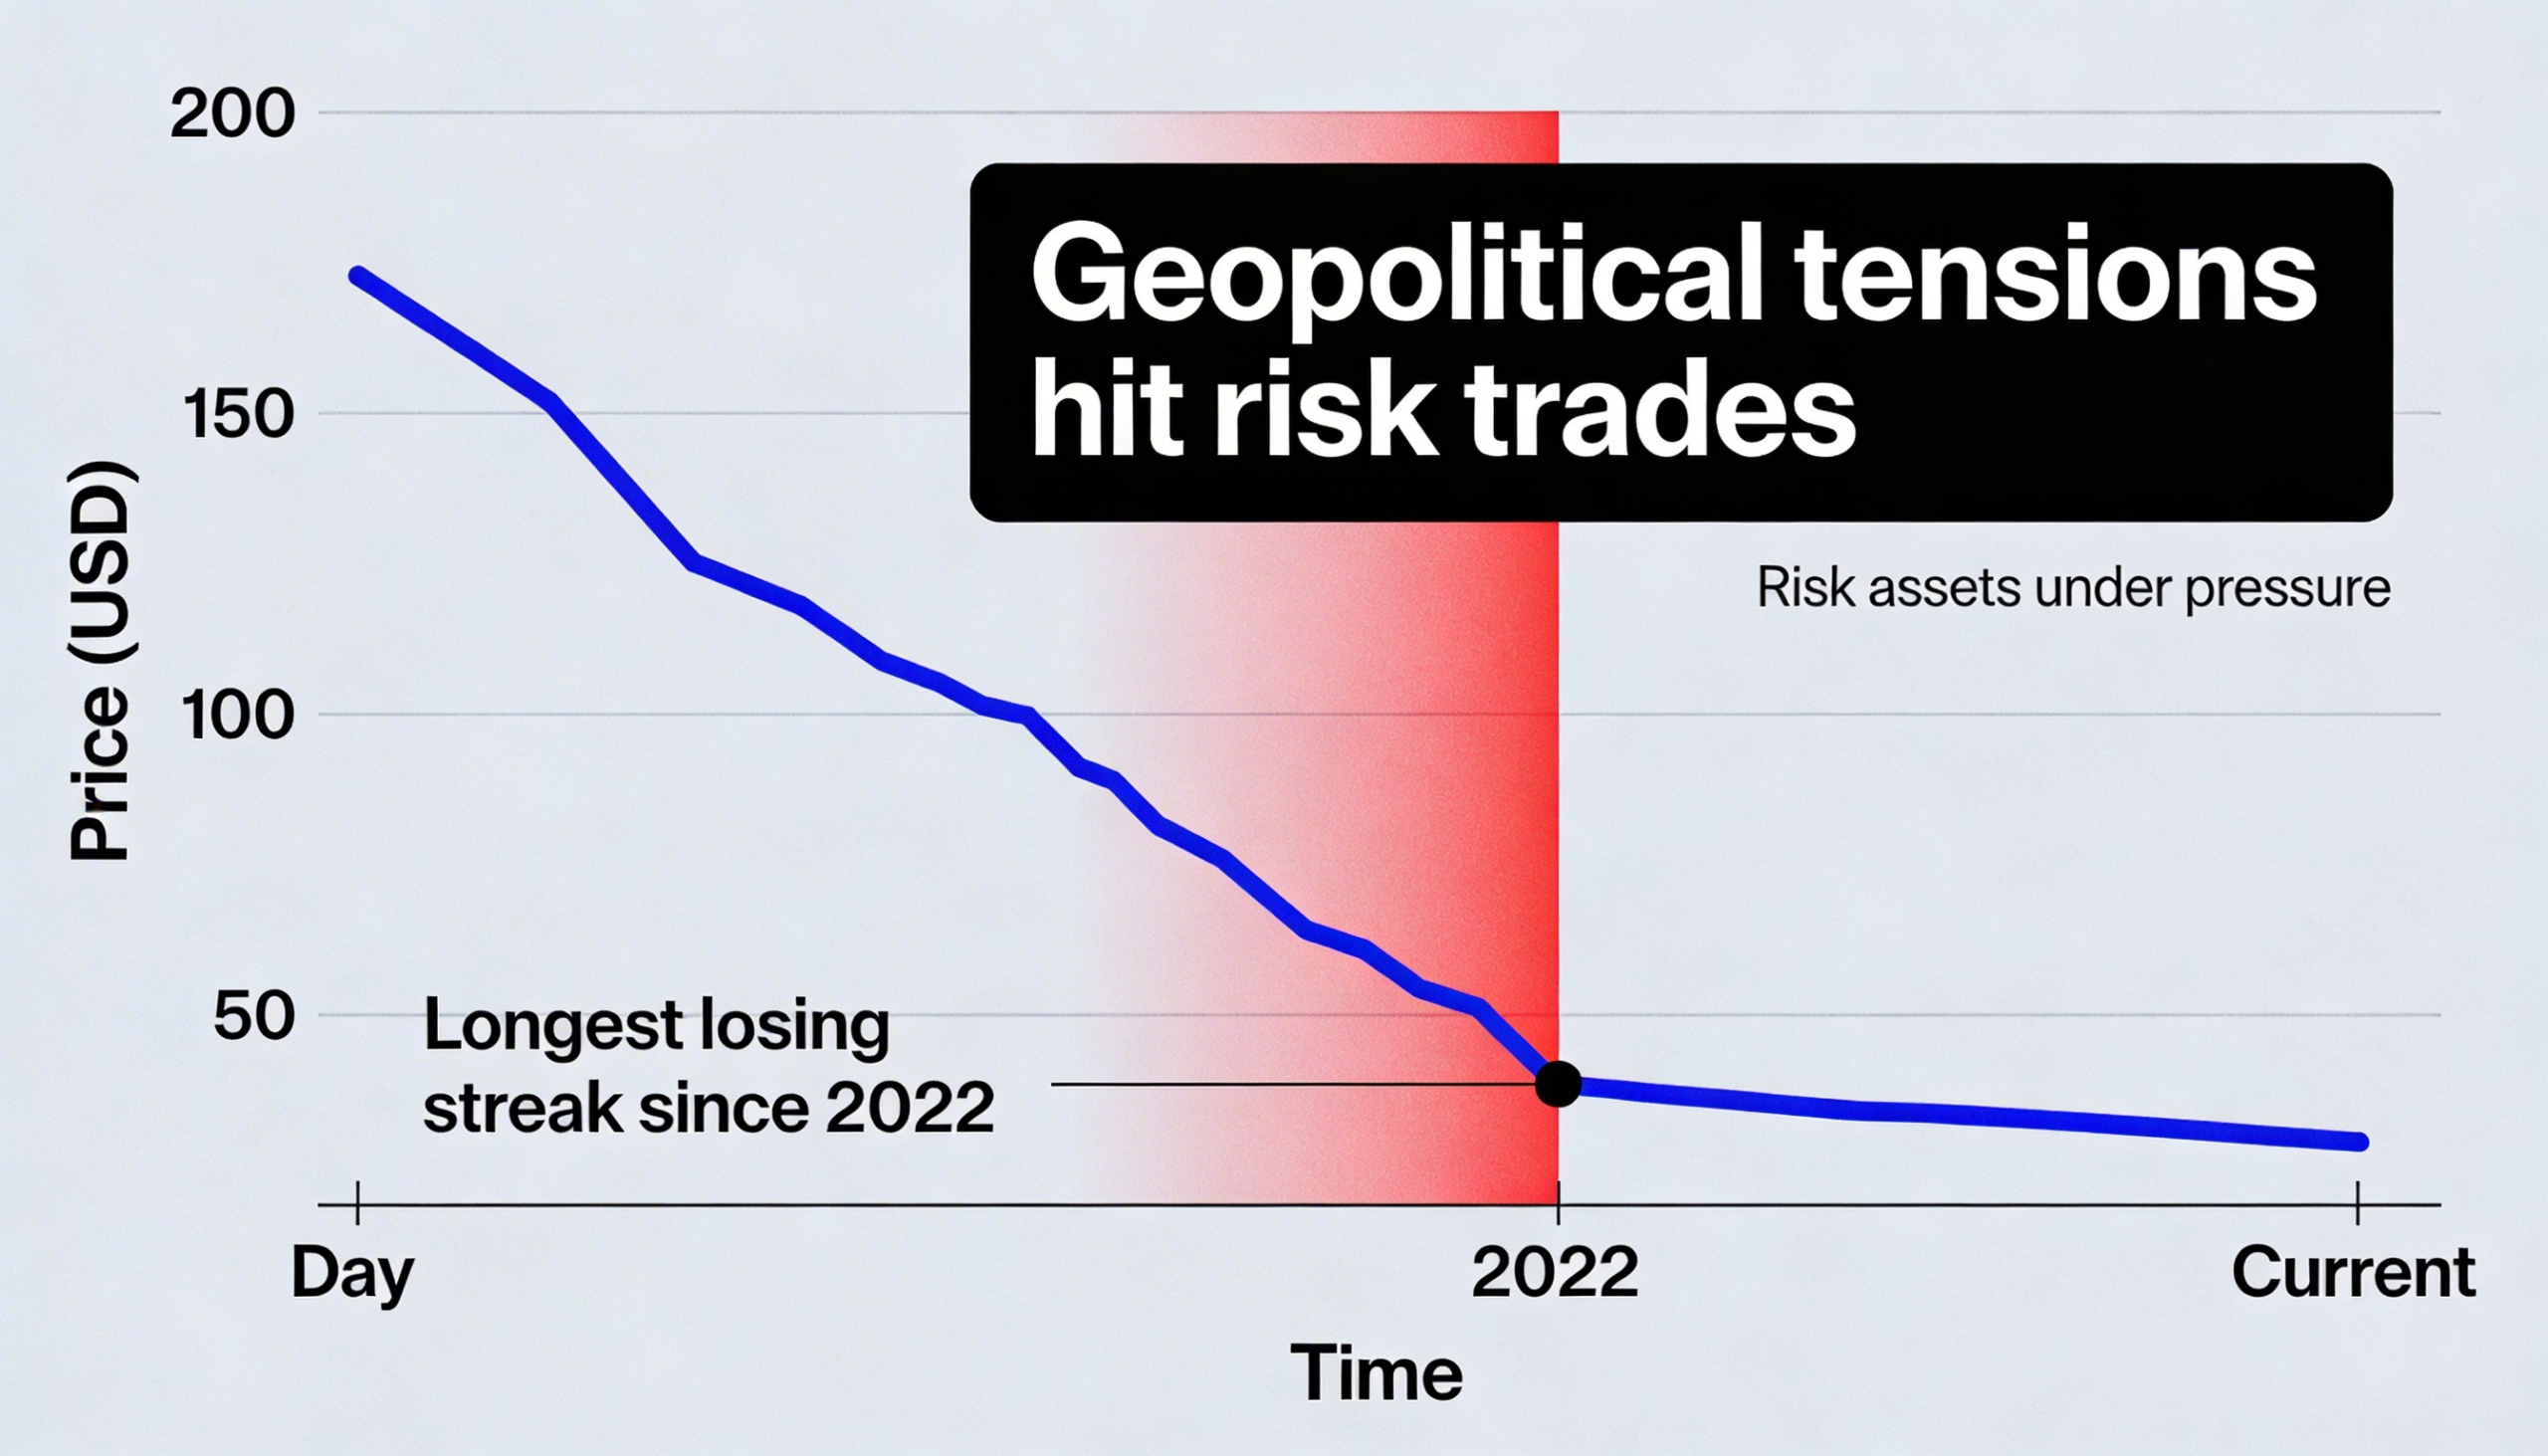
Currently trading around $66,000, bitcoin remains under pressure, with sentiment lodged in “fear” or “extreme fear” territory on the Crypto Fear & Greed Index for much of the past month. Since topping out in October, the asset has declined by more than 50%, briefly sliding toward $60,000.
If historical patterns repeat, the latest oversold signal may point to a prolonged period of range-bound trading around the $60,000 area before the next upward cycle begins.