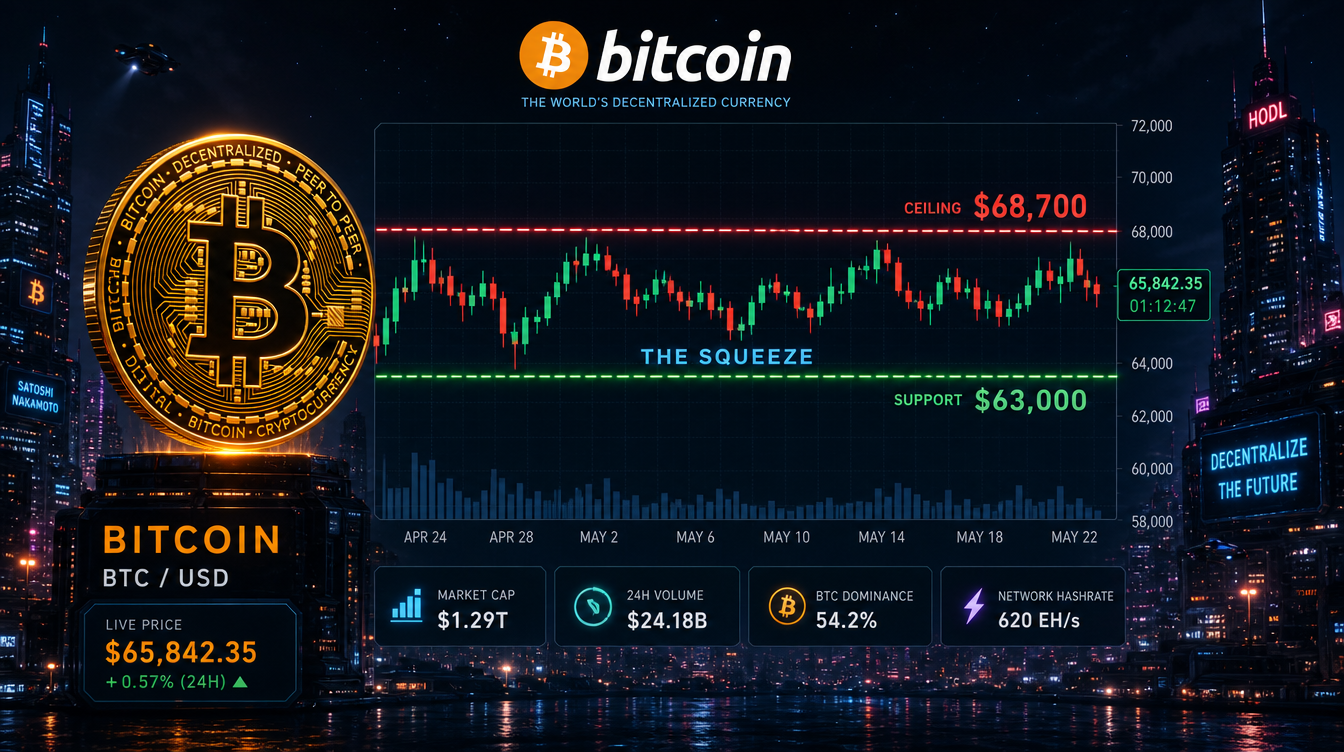
Bitcoin remains locked between $63,000 and $68,700 as weak spot demand, Bitcoin ETF outflows and whale selling keep the market vulnerable to a sharp breakout or breakdown.
BTC traded in a narrow $63,500-$64,000 range this week, according to CoinGecko data, continuing to struggle with the $65,000 level.
Bitcoin’s spot exchange volume has dropped to its lowest level since Glassnode began tracking the metric in early 2019, according to data shared by Wu Blockchain. Meanwhile, Crypto Rover reported that BTC volatility has fallen to levels last seen in October 2023.
The current market stagnation appears to reflect more than seasonal summer trading. Fresh buying demand and forced selling have both faded, leaving Bitcoin caught between two key cost-basis levels that are steadily converging.
Bitcoin’s Key Support and Resistance Levels
Bitcoin is currently trading between the $63,000 median realized price and the $68,700 short-term holder cost basis.
The $63,000 median realized price represents the midpoint of Bitcoin holders’ aggregate acquisition costs and has emerged as an important support zone. The $68,700 short-term holder cost basis, meanwhile, reflects the average entry price of recent buyers and is acting as overhead resistance.
Glassnode’s Week 32 research showed that Bitcoin has remained within this range for nearly three months, with the gap between the two levels narrowing as volatility declines.
Analyst Ted Pillows noted that BTC has failed to reclaim $65,000 even as equities and precious metals have moved higher. He viewed the divergence as a sign that Bitcoin’s momentum is weakening and suggested that a pullback toward $60,500-$61,000 could occur before another rebound.
Glassnode has identified $58,500, the June low, as another critical level if Bitcoin falls below the median realized price. Thin order books and high leverage could make any downside move more abrupt, the analytics firm warned.
Whale Activity and ETF Outflows Weigh on BTC
Lookonchain data showed that a wallet associated with Paxos sold another 800 BTC, worth approximately $50.72 million, through Wintermute.
The wallet has sold around 2,500 BTC over the last two months, representing nearly $154 million. The coins have been sold gradually rather than through a single large transaction. While the selling alone may not be enough to trigger a major decline, it adds to market supply at a time when buyers remain cautious.
U.S. spot Bitcoin ETFs recorded $61.16 million in net outflows on Aug. 12, including $46.82 million withdrawn from Fidelity’s FBTC. Combined with exceptionally weak spot trading activity, the ETF flows suggest institutional demand has cooled.
Bitcoin Bull and Bear Cases
A sustained break above $68,700 could strengthen the bullish outlook, particularly if spot trading volume picks up and Bitcoin ETFs return to net inflows. Such a move could push recent holders back into profit and open the way toward new local highs.
Crypto Rover noted that Bitcoin experienced a similarly tight volatility squeeze in October 2023 before eventually gaining more than 330%. Although the historical pattern does not guarantee a comparable rally, it remains a reference point for traders watching the current setup.
On the bearish side, losing $63,000 could expose Bitcoin to the $60,500-$61,000 region. A deeper sell-off could bring the $58,500 June low into focus.
Glassnode’s seller-exhaustion indicators are nearing levels previously associated with major market bottoms. However, the firm said spot demand remains weak, with bitcoin continuing to flow onto exchanges even as signs of seller fatigue emerge.
A global interest-rate shock is another potential catalyst. A sharp shift in rates could trigger a carry-trade unwind and push Bitcoin out of its prolonged consolidation.
With liquidity thin and trading volumes near historic lows, Bitcoin could see an outsized move once either buyers or sellers finally take control.