Bitcoin’s long-term momentum indicator turns bullish as traders track key resistance zones
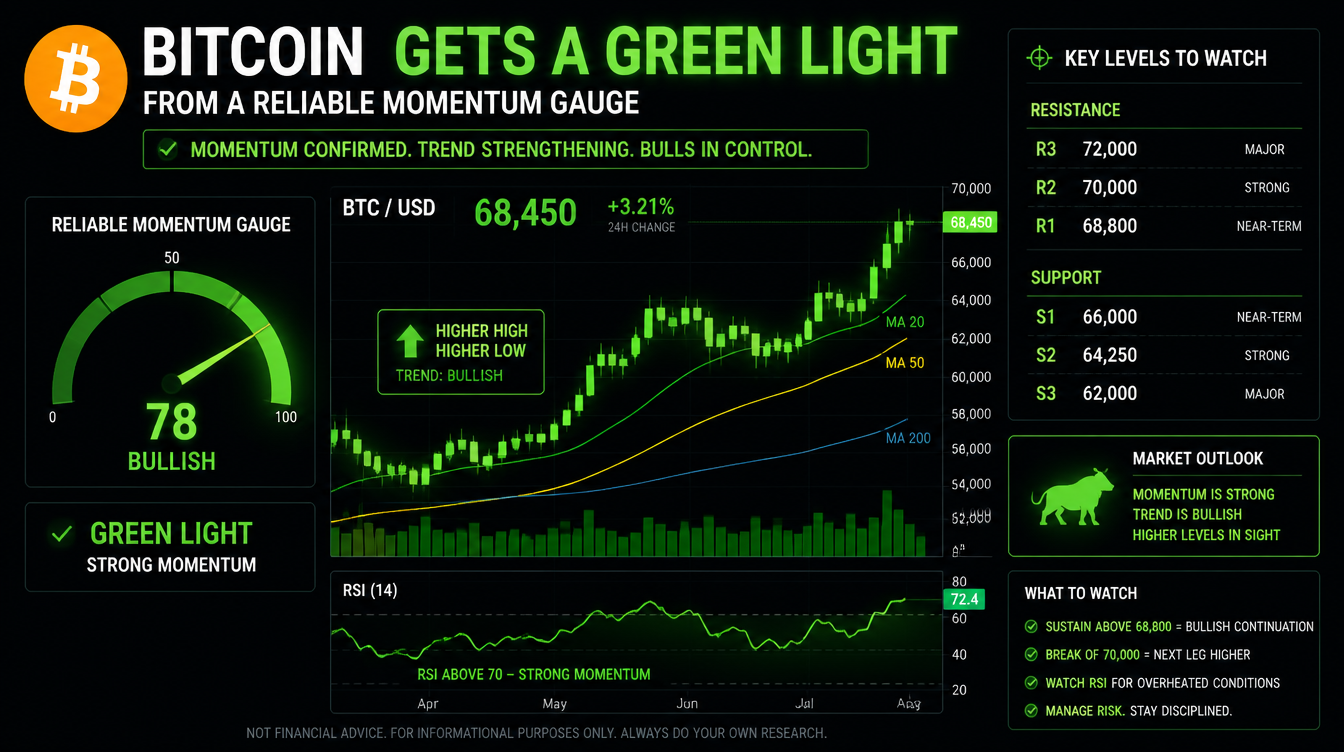
Bitcoin’s broader momentum outlook has improved after a smoother version of the MACD indicator flipped positive, suggesting the current recovery could continue. However, BTC still faces several important resistance levels that will determine whether the rebound develops into a stronger upward trend.
Bitcoin has climbed nearly 10% this month and is now positioned for a potential move toward the $70,000 area, a zone that has repeatedly prevented further advances in recent months.
The signal comes from the moving average convergence divergence (MACD) histogram, a widely used technical indicator that tracks changes in market momentum and trend direction. When the indicator rises above the zero line, it is generally viewed as a sign of strengthening bullish momentum, while a drop below zero indicates weakening conditions.
The traditional MACD model uses 12-day and 26-day moving averages along with a 9-day signal line. However, these shorter settings can produce frequent false signals during periods of volatility. Many traders therefore use longer-term versions, such as a 50-day, 100-day, and 9-day setup, to identify broader market trends more clearly.
The longer-term MACD histogram has now moved above zero, marking a shift toward positive momentum. The signal suggests bitcoin’s recent rebound may have more room to develop instead of fading quickly. BTC was trading slightly above $64,000 at the latest reading.
Although traders rarely make decisions based on a single indicator, this long-term MACD signal has historically been useful during major market cycles. Since bitcoin’s decline from its record high near $126,000, bearish crossovers have often appeared before deeper downturns, while bullish signals have been followed by notable recoveries, including the December–January and February–May rallies.
The latest bullish crossover points toward further upside potential, but it does not guarantee the start of a new bull market. Bitcoin must still clear several technical barriers before a stronger trend can be confirmed.
Key Bitcoin Resistance Levels
50-day moving average: Around $65,434
The first major test for bitcoin is the 50-day simple moving average, which reflects the average BTC price over roughly the past two months. Traders closely monitor this level to assess short-term momentum. A decisive break above it could indicate increasing buyer strength.
$67,292 resistance
The next important level is the mid-June high near $67,292. Bitcoin recovered from early June lows around $60,000 before encountering heavy selling pressure at this point. Moving above this level would suggest buyers have overcome a key resistance area.
200-day moving average: Around $71,147
The most significant hurdle is the 200-day moving average, one of the market’s most closely watched long-term trend indicators. Bitcoin previously failed to break through this level during its early May recovery attempt. A sustained move above it would provide stronger confirmation of a potential long-term uptrend.
Until these levels are reclaimed, traders may remain positive on bitcoin’s outlook while maintaining caution.
$80,000 Options Zone Could Increase Market Swings
Beyond technical resistance, traders are also watching the $80,000 strike price in Deribit’s bitcoin options market. The level holds more than $1.21 billion in open interest, representing the largest concentration of options exposure on the platform.
If bitcoin approaches this area, position adjustments by options traders could increase activity in spot and futures markets, potentially creating additional volatility.