The key question is whether current market activity begins to form a reversal signal—or whether continued selling pressure simply outweighs any signs of stabilization.
Discover: The Best Crypto to Diversify Your Portfolio
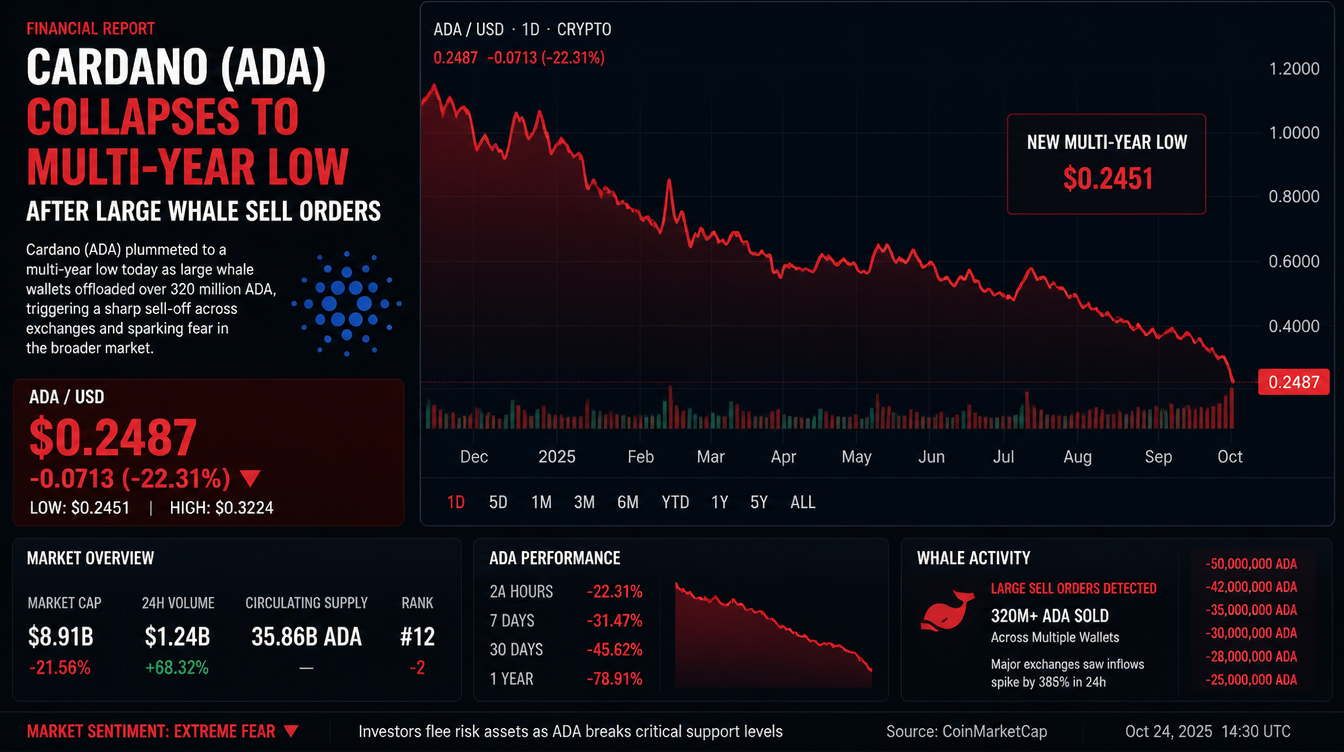
Cardano News: What On-Chain Data and Whale Activity Indicate
Recent on-chain data from Santiment shows a notable surge in Cardano’s Age Consumed metric alongside a flattening of Mean Dollar Invested Age as ADA fell to around $0.1485. These indicators suggest that previously inactive long-term holders may have started moving tokens, a pattern often associated with capitulation or large-scale redistribution rather than normal market turnover.
At the same time, whale behavior has reinforced the bearish trend. Wallets holding between 10–100 million ADA have reportedly offloaded roughly 180 million tokens over a short period, while the 1–10 million ADA cohort previously reduced positions by more than 560 million tokens over a four-day span.
This selling pressure is also occurring within a wider risk-off environment across crypto markets. ETF outflows, institutional de-risking, and broader geopolitical uncertainty have contributed to weakness across altcoins, suggesting Cardano’s decline is not entirely isolated.
From a technical perspective, the 50-, 100-, and 200-day exponential moving averages are all stacked between $0.23 and $0.33—well above current price levels. This alignment typically reflects a structurally broken trend rather than a short-term pullback.
Cardano Price Prediction: Where ADA Could Go Next
Over the past two years, Cardano has gone through a pronounced boom-and-bust cycle on the weekly chart. After consolidating in a range between $0.35 and $0.50 through mid-2024, ADA surged sharply in late 2024, reaching a peak near $1.35–$1.40 in early 2025.
That rally was followed by heightened volatility and a steady sequence of lower highs throughout 2025. Since the second half of the year, ADA has remained in a persistent downtrend, erasing much of its previous gains and recently touching new lows around $0.1666. As of June 11, 2026, the token trades near $0.1666, up slightly on the week but still sitting at the lower boundary of a multi-month descending channel.
Momentum indicators reflect extreme weakness, with the 14-day RSI reading at approximately 27.83—deeply oversold territory. This suggests selling pressure may be stretched in the short term, potentially opening the door for a relief bounce or sideways consolidation. However, the broader trend structure remains decisively bearish, with price action now revisiting levels last seen during earlier bear market conditions, underscoring the extent of the drawdown from 2025 highs.