A roughly 50% pullback from recent highs has pushed bitcoin into a zone historically linked with extreme bearish sentiment, reigniting debate across the crypto market.
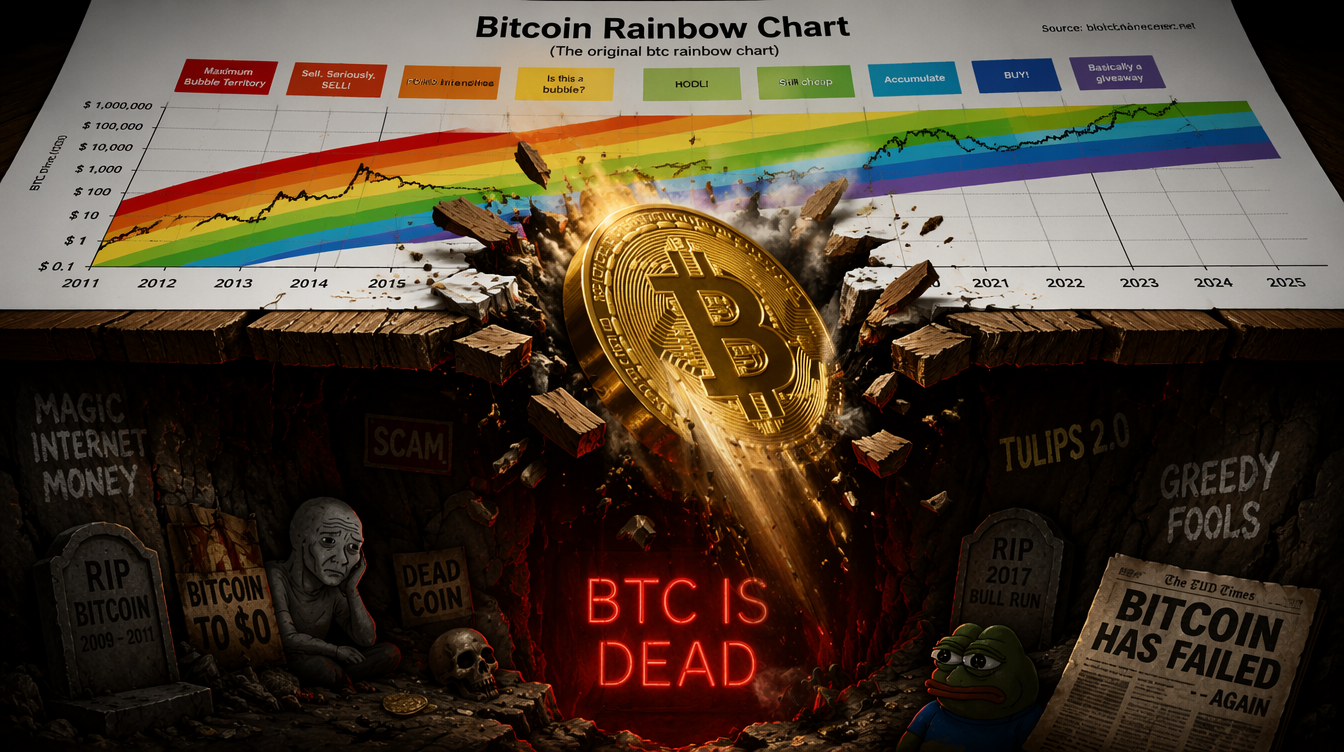
Bitcoin has slipped below the lowest band of the widely tracked Rainbow Chart for only the second time in its history. The long-running model, created more than a decade ago, maps BTC’s price cycles using a logarithmic growth curve and color-coded sentiment bands.
Some investors interpret the move as a potential buying signal. Analyst CryptoRover compared the current setup to 2022, when bitcoin last entered this zone near $15,000 before eventually bottoming out.
Now trading around $62,500, bitcoin is down roughly 50% from its October 2025 peak of $126,000. The drop has pushed it beneath the floor of the modern nine-band Rainbow Chart and into the original model’s purple “Bitcoin Is Dead” zone—a level historically associated with peak fear rather than a literal collapse.
The breakdown has sparked debate over whether bitcoin is deeply undervalued or whether the Rainbow Chart is losing relevance as institutional flows, ETFs and macroeconomic forces play a larger role in price action.
The Rainbow Chart, introduced in 2014 by Reddit user Azop, is based on historical price trends and assigns different sentiment phases using color bands.
Analysts are divided on its meaning. Markus Levin, co-founder of XYO, argued the breach signals a structural shift in the model rather than weakness in bitcoin itself, suggesting the asset has outgrown earlier assumptions.
Others disagree. Ryan Lee, chief analyst at Bitget, said the chart remains useful for visualizing long-term cycles but should not be treated as predictive, given its reliance on historical patterns rather than evolving market dynamics.
Emad Shahin, COO of Ethra, also described the chart as more of a sentiment gauge than a forecasting tool, warning that such models often fail at key turning points.
Bitcoin’s failure to reach the chart’s upper red bands during its $126,000 peak—and its current move below the lower boundary—highlights a widening gap between price action and traditional valuation frameworks. Other models, including Stock-to-Flow, have also struggled to accurately predict recent performance.
Mark Zalan, CEO of GoMining, noted that the “Bitcoin Is Dead” zone has historically marked periods of fear and undervaluation, often followed by recoveries rather than long-term declines.
However, he acknowledged that the model has become less precise as market structure evolves. The growing influence of institutional capital, ETFs and derivatives has reshaped price discovery, making legacy models less reliable on their own.
Bitcoin is now trading close to its April 2024 halving level, defying expectations tied to the typical four-year cycle.
Levin added that the Rainbow Chart was built for a more retail-driven and illiquid market, whereas today’s bitcoin operates within a much larger, more complex financial ecosystem.
Analysts also suggest that increasing institutional participation may be reducing the extreme volatility that once defined bitcoin cycles.
Lee said that while sentiment appears weak near the bottom of the chart, it does not necessarily signal further sharp declines. A drop toward the low-$50,000 range remains possible if broader risk sentiment worsens, but the chart itself offers limited clarity on where a definitive bottom may form.
Whether bitcoin re-enters the Rainbow Chart’s historical range or continues to trade outside it may ultimately determine whether the model remains relevant—or becomes obsolete in an evolving market.